
Revenue teams pour effort into the forecasting model and far less into what feeds it. That is backwards. A sales forecast is only as accurate as the data behind it, and when the number misses, the cause is rarely the formula.
Forecast accuracy is an inputs problem before it is a math problem, and the teams who hit their number quarter after quarter fix the inputs first. The six tactics below are the moves revenue leaders use to close the gap between the number they call and the number they land.
What Forecast Accuracy Measures
Forecast accuracy is a measure of how closely a forecast matches real results, usually expressed as the percentage difference between projected and realized revenue over a given period.
In revenue terms, it is the gap between the bookings and close dates you called and what landed by the end of the quarter. A forecast that calls 4 million in bookings against 4.1 million in actuals is tight and trustworthy. One that calls 4 million against 2.8 million signals a problem that runs deeper than the number itself. A miss that size means the team had no line of sight into its own deals, which turns every downstream decision on hiring, spend, and board guidance into a guess.
Teams that improve stop measuring accuracy as one blended figure checked once a quarter. A single number hides the truth. Like any of your sales metrics, the diagnosis lives in accuracy broken out by:
Pipeline stage, so you see where deals stall or die
Rep, so you catch who sandbags and who happy-ears the number
Segment, so enterprise misses do not hide behind mid-market wins
Lead source, so you know which channels forecast reliably
There is a standard way to score this. Mean Absolute Percentage Error, or MAPE, averages the size of your misses as a percentage of actuals. Treat it as a scoreboard rather than a fix. A MAPE of 22% tells you the forecast is unreliable and says nothing about why. For that, look at what went into the forecast in the first place.
Why Sales Forecasts Miss the Number
Forecasts miss for reasons that have little to do with the forecasting method. Trace the misses back to the source and the same three culprits show up every time.
Dirty data. Contacts go stale the moment someone changes jobs, account details drift, and deals sit attached to buyers who left months ago. A forecast built on bad data inherits every error in it.
Inconsistent stages. One rep marks a deal Stage 3 after a discovery call, another waits for a proposal. Same label, different reality. Any rollup that averages those stages is averaging timelines that do not match.
Rep optimism. Close dates slip to the last week of every quarter, "commit" deals stall for reasons nobody logged, and the forecast reflects how reps feel about deals rather than what buyers are doing.
These three failures share one root cause. The numbers feeding the forecast no longer reflect reality, and even clean-looking stage data can hide deals that have quietly gone cold. That is the case for forecasting on facts over feelings, and it begins with fixing these three inputs before you touch the model.
The Forecast Accuracy Playbook
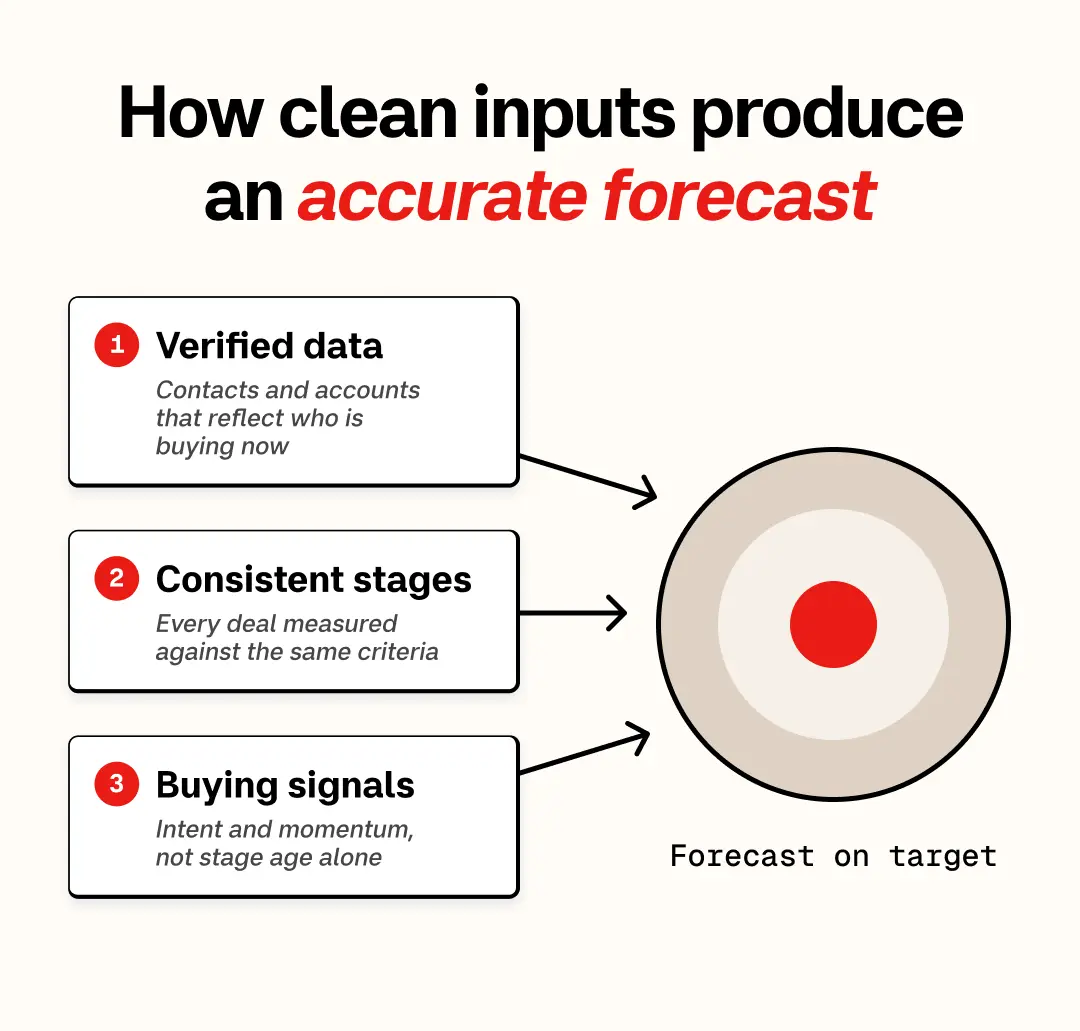
Improving accuracy comes down to a repeatable set of moves, each aimed at a different input the forecast depends on. Work through them in order. The first three clean the data and structure feeding the forecast, and the last three turn that clean input into a projection you can act on.
1. Clean the Data Feeding Your Forecast
An accurate forecast starts with data you can trust, meaning every account and contact in the pipeline reflects who the buyer is today rather than who they were when the record was created. When a champion changes roles or a number goes dead, the forecast quietly loses accuracy and nobody notices until a committed deal goes dark. Research on forecast accuracy bears this out, identifying data as the single biggest driver of how accurate a forecast turns out.
Get the foundation right with a few non-negotiables:
Enrich and verify at the source. Continuous data enrichment refreshes records against a verified data set instead of trusting what a rep typed in eighteen months ago.
Deduplicate and complete records. Merge duplicates and fill the firmographic gaps that skew segment-level forecasts, working from a data quality checklist so the same gaps do not reappear.
Run CRM hygiene on a schedule. Keep the data clean between enrichment passes so poor data quality never compounds.
Trigger re-verification on change. Job changes, funding rounds, and org shifts should refresh a record automatically, so the forecast never runs on a buyer who moved on last quarter.
This is where a platform like ZoomInfo carries the load. It maintains a living picture of the market, more than 500 million professional contacts and 100 million companies, backed by over 135 million verified phone numbers and 200 million verified business emails at up to 95% first-party accuracy, kept current by a research operation that continuously re-checks the facts. Enrich your CRM against that foundation and the accounts in your forecast are real, reachable, and current, which removes the single largest source of forecast error.
2. Standardize Your Pipeline Stages
Once the data is trustworthy, the next lever is how consistently the team runs the pipeline. Stage definitions have to mean the same thing for every rep and every deal. That sounds obvious, and it is the discipline teams skip.
A core piece of sales process optimization is writing down exactly what has to be true for a deal to enter each stage. A Stage 2 opportunity should carry three conditions before it counts:
A qualified buyer with a confirmed need
Budget in the conversation
A committed next step on the calendar
When the criteria are explicit, stage progression becomes evidence instead of opinion, and the rollup starts to hold.
Florin Tatulea, GTM Engineer in Residence at ZoomInfo, tracks four numbers per pipe-gen stream to keep that base honest:
Stage-1-to-Stage-2 conversion rate, from first meeting to qualified opportunity
Average deal size, so pipeline dollars translate into realistic bookings
Stage-to-stage velocity, how fast deals move through the sales cycle from one stage to the next
Meeting-to-opportunity timing, measured in weeks so each cohort is comparable
He forecasts by cohort based on first-meeting date, which forces the team to watch each batch of opportunities move through the funnel rather than staring at an aggregate that hides the pattern. Cohort tracking surfaces the drop-offs early, while there is still time to act on them. Run the numbers against a defined stage model and the forecast reads as a projection of measurable behavior rather than a wish.
A sales pipeline with clean stages and honest conversion rates gives the forecast a stable base to project from, and disciplined sales pipeline management keeps that base honest week over week.
3. Weight the Forecast With Buying Signals
Historical conversion rates tell you what usually happens. They say nothing about what is happening inside a specific account right now. A deal can look healthy on paper, sitting in the right stage with a strong conversion history, while the buying group has gone quiet or started evaluating a competitor. History-based forecasting is blind to that shift until it lands as a loss.
Buying signals change the read:
Intent data shows which accounts that fit your ideal customer profile are researching your category right now.
Buying signals like leadership changes and funding events flag when an account enters a buying window.
Weighted momentum lets you rank deals by the buying signals that matter instead of stage age, so the projection reflects movement rather than assumption.
ZoomInfo builds this into the forecast through its GTM Context Graph, which processes more than 1.5 billion data points a day to connect who a buyer is with what they are doing, the intelligence layer beneath the forecast.
The graph is the difference between knowing an account exists and knowing it is in-market, the "why" behind the "what." Layered onto your pipeline, that context separates the deals with real momentum from the ones coasting on a stale stage, which is the exact distinction a forecast has to get right.
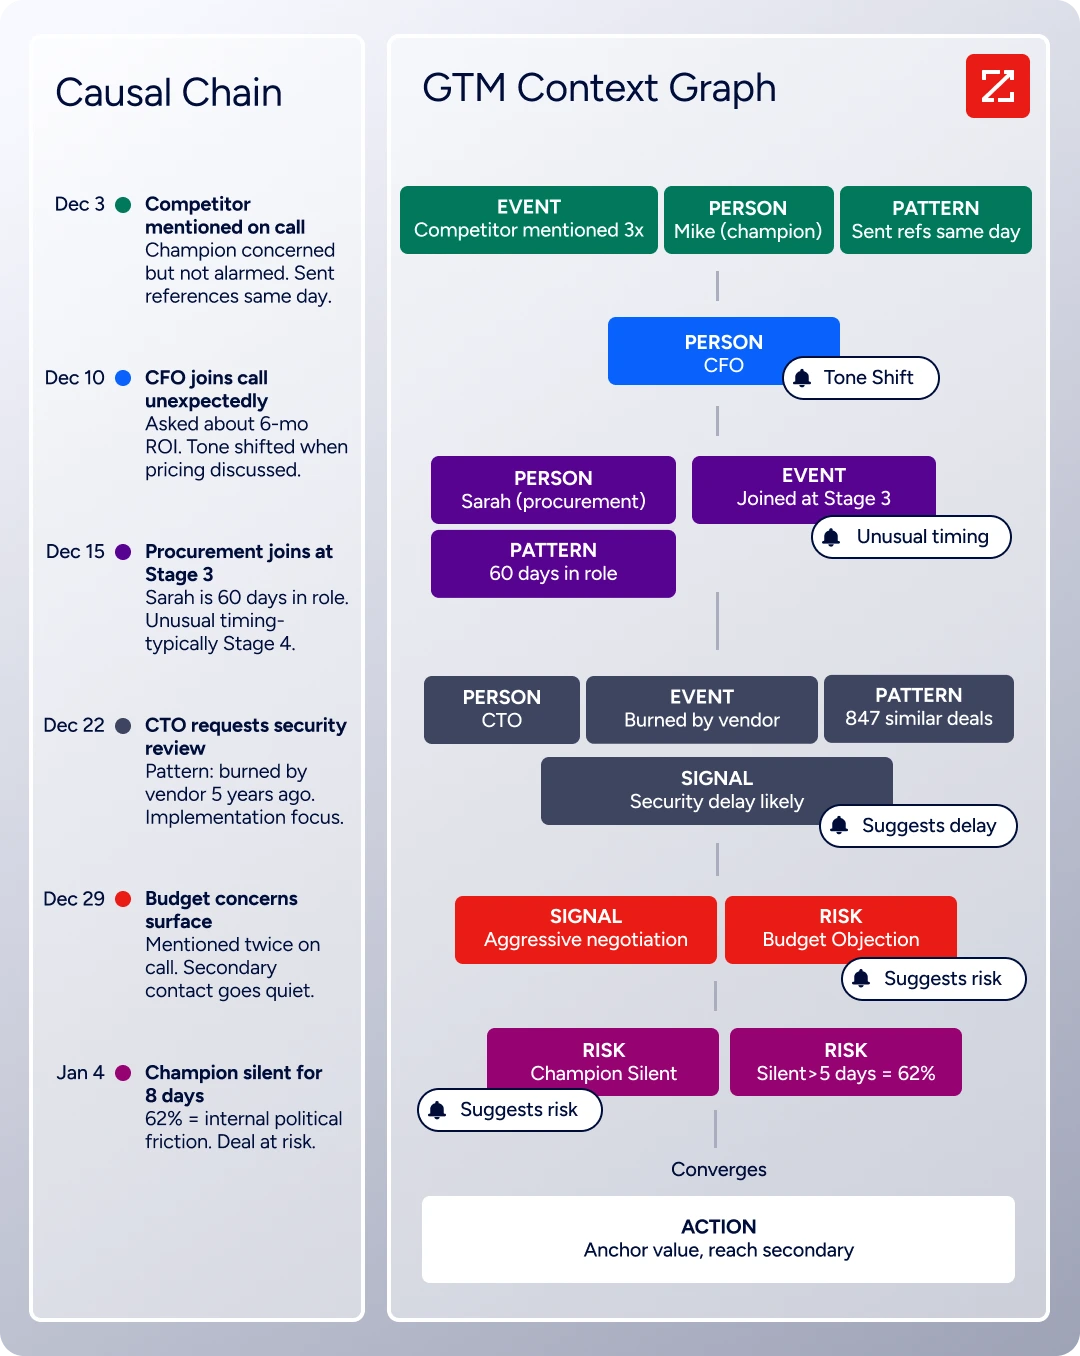
The effect shows up deal by deal. Two opportunities can sit in the same stage with the same age and the same deal size. Signal data, updated in real time, reveals that one account has three new stakeholders researching your category and a recent leadership hire in the buying unit, while the other has gone silent since the last call. A history-only forecast weights them identically. A signal-weighted forecast pulls the first one forward and flags the second for review, and over a full quarter that difference is the gap between a forecast that holds and one that unravels in the final week.
Put AI on your forecast: See the best AI sales forecasting tools built to turn pipeline signals into a projection you can trust.
4. Automate CRM Hygiene With AI
Forecasts drifted for years because keeping inputs clean was manual, and manual work loses to a busy quarter every time. Reps skip logging call notes, context lives in email threads and call recordings the CRM never sees, and the data decays. Keeping CRM data ready for AI used to be a losing battle against a busy quarter. AI changes the economics of that problem.
Modern GTM platforms now use AI agents to capture context automatically:
Conversation intelligence transcribes and analyzes every call, then writes the buying group, objections, and next steps back into the CRM without a rep touching a field.
Propensity scoring ranks accounts by likelihood to close, replacing rep sentiment with a data-backed read.
Exception-based alerts flag the deals that fall outside normal patterns, drawing on deal intelligence so overrides happen only where the data warrants them.
ZoomInfo delivers this through its platform layer, where the verified data and the Context Graph reach the whole revenue team. Sellers work inside the GTM Workspace, where account context and next-best actions surface in the flow of the deal. Marketers, RevOps, and GTM engineers use GTM Studio to score and prioritize accounts, and any team can pull that intelligence into its own tools through GTM.AI and its MCP connections.
As Tatulea notes, agents that auto-input notes from call transcripts have made the input problem far more manageable than it was a year ago.

"Once our APS system produces a score, we put it in front of field operations leads so they can allocate those accounts as efficiently as possible."
5. Track Your Forecast Delta Every Week
The habit that separates teams who forecast well from teams who guess is measuring the delta, the gap between projection and result, tracked every period. Tatulea calls this the step teams skip. The delta is how you find out whether you have a real grip on the business or are hoping. In most teams the discipline sits with revenue operations, which owns the forecast cadence and the data behind it.
Track it by segment, rep, and lead source rather than in aggregate. A blended accuracy number can look fine while enterprise deals run consistently over-forecast and mid-market runs under, the two errors canceling on the surface. Break the delta down and the pattern in your misses becomes obvious, and that pattern is the roadmap for what to fix next.
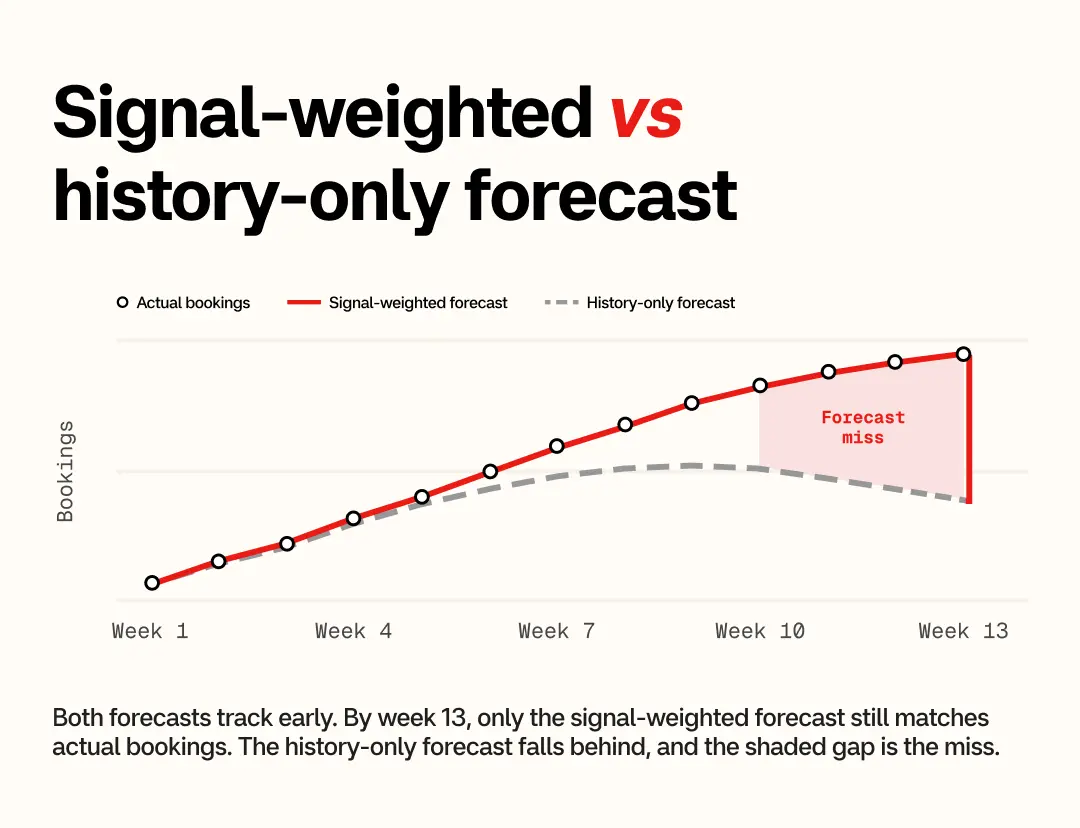
Make it a weekly rhythm rather than a quarterly reckoning. Reviewing the delta every week keeps the sample small enough to diagnose. A single stage where conversion dropped, one rep whose commits keep slipping, or a lead source that over-promises all stand out while there is still time to correct them. Wait for the quarter to close and those signals blur into one disappointing number with no clear cause.
The payoff is early action. When the forecast for the coming weeks looks weak, catching it now means you can build pipeline, reallocate reps, or pull deals forward while the outcome is still in play. A forecast you track continuously becomes an early-warning system rather than a post-mortem. Tie it to the sales KPIs that drive the number and the delta stops being a scorecard and starts being a management tool.
6. Plan for Multiple Forecast Scenarios
Even a well-fed forecast is a single point estimate, and single points break under real volatility. A key deal slips, a competitor cuts price, a market shifts, and the one number you committed to is wrong. Scenario planning replaces the fragile point with a defensible range built on three cases:
Conservative. Assume the deals carrying any real risk slip or die.
Realistic. Your best read of the pipeline, weighted by signal and history.
Optimistic. The stretch deals close on time.
The spread between them tells you how much uncertainty the quarter holds and hands leadership a range instead of false precision. Scenarios also make the forecast a planning tool. If the conservative case falls short of target, you know today that you need more pipeline and roughly how much. If even the optimistic case misses, the problem is structural, and no end-of-quarter heroics will close it.
Build a Forecast You Can Trust
Improving forecast accuracy is less a project than a habit. The through-line across all six tactics is that accuracy is built rather than calculated:
Verify the data so the pipeline reflects real buyers.
Standardize stage definitions so the rollup means something.
Weight the forecast with buying signals so it reads momentum.
Let AI keep the inputs clean so the discipline survives a busy quarter.
Track the delta so you always know where you stand.
Run scenarios so a single slip does not sink the plan.
None of it requires a more complicated model. It requires better inputs and the discipline to maintain them, which is within reach of any revenue team willing to do the work.
Bringing those inputs together in one place is what ZoomInfo is built for. Its all-in-one AI GTM platform combines a verified data foundation, live buying signals from the GTM Context Graph, and AI agents that keep the CRM current, so the forecast projects from data that reflects the market instead of rep sentiment. Teams that treat forecasting as an ongoing practice built on clean data are the ones who stop getting surprised.
See it on your own pipeline: Book a ZoomInfo demo and watch verified data, buying signals, and AI-driven hygiene sharpen your forecast.
Frequently Asked Questions
What is a good forecast accuracy level?
Landing within 5 to 10% of actuals is strong for revenue forecasting, and consistently staying under a 10% miss puts a team in good shape. The exact benchmark shifts by business, segment, and how far out the forecast reaches. What matters more than a universal target is the trend. An accuracy figure that tightens over time means the inputs and process are improving.
What is the fastest way to improve forecast accuracy?
Clean the inputs. Verify and enrich the contact and account data in your pipeline, then standardize stage definitions so every deal is measured the same way. Those two moves remove the largest sources of error and lift accuracy before any change to the forecasting model.
How is forecast accuracy calculated?
The common method is Mean Absolute Percentage Error, or MAPE, which averages the absolute size of your forecast misses as a percentage of actual results. A lower MAPE means a more accurate forecast. It scores accuracy over time but diagnoses the size of the problem rather than the cause.
Why do sales forecasts miss so often?
The misses trace back to inputs rather than method. Stale or incomplete CRM data, pipeline stages reps define inconsistently, and close dates driven by optimism instead of evidence are the usual causes. When the data feeding the forecast is unreliable, the forecast is unreliable no matter how sophisticated the model.
Can AI improve forecast accuracy?
Yes, mainly by fixing the input problem that breaks forecasts. AI agents capture call context and log it into the CRM automatically, keeping records current, and AI scoring ranks accounts by real propensity to buy instead of rep sentiment. Both give the forecast cleaner, more forward-looking data to project from.
What is the Golden Rule of forecasting?
Base the forecast on evidence rather than opinion. A reliable forecast draws on verified data, consistent stage definitions, and observed buyer behavior instead of a rep's confidence about a deal. Keep the inputs objective and the projection follows.
What are the four main methods of sales forecasting?
The four common approaches are historical forecasting, which projects from past performance; opportunity-stage forecasting, which weights deals by pipeline stage; length-of-sales-cycle forecasting, which uses deal age and velocity; and multivariable or AI forecasting, which combines pipeline data with buying signals. The strongest programs blend several rather than leaning on one.
Which forecasting method is most accurate?
No single method wins on its own. Accuracy comes from pairing a data-driven method, usually opportunity-stage or multivariable forecasting, with clean inputs and live buying signals. AI-assisted forecasting tends to land closest because it weights deals by real propensity to buy rather than rep sentiment.
