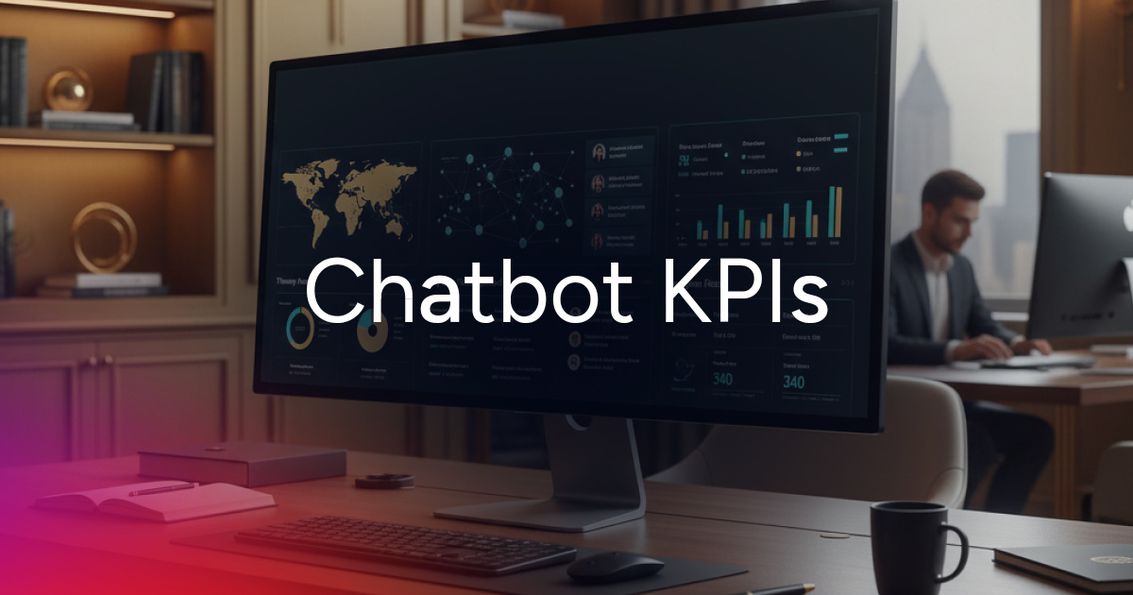

Why chatbot metrics matter for revenue teams
Most teams deploy a chatbot, watch the session count climb, and call it a win. The problem is that session count tells you nothing about whether the bot is generating pipeline. Chatbot metrics only earn their place in a revenue conversation when they connect visitor behavior to meetings booked, leads qualified, and deals influenced. The gap between "we have a chatbot" and "our chatbot drives pipeline" is almost always a measurement gap.
According to Gartner analysts, customer support leaders consistently struggle to identify actionable chatbot metrics. The gap is not awareness of KPIs but the ability to translate metric data into improvement decisions. That same pattern shows up in demand gen teams: plenty of dashboards, very little closed-loop accountability.
Chatbot metrics connect bot activity to pipeline generation and cost savings by measuring lead qualification accuracy, conversion rates, and routing efficiency. Without these KPIs, you cannot tell which conversations turn into meetings, which leads match ICP, or where handoffs break down. Most teams track vanity numbers like total chats and uptime. Revenue teams track what actually matters: meeting conversion rate, ICP match rate, and pipeline influenced.
Without measurement, chatbot investment becomes unaccountable spend. Here is what happens when teams do not track chatbot performance:
Wasted budget: No visibility into whether the bot drives meetings or just noise.
Missed handoffs: Leads fall through cracks between bot and human follow-up.
No optimization path: You cannot improve what you do not measure.
A framework for evaluating chatbot performance
Not all chatbot metrics carry equal weight for revenue teams. A session count and a pipeline-influenced number are both "chatbot metrics," but one belongs in a weekly ops review and the other belongs in a board deck. Before diving into individual metrics, it helps to organize them into four tiers that reflect how each layer of performance connects to business outcomes.
Tier 1: Engagement and Adoption. Are visitors actually using the bot? These metrics establish whether the chatbot has traction at all. For B2B demand gen teams, low engagement often signals a placement or messaging problem, not a data problem.
Tier 2: Resolution and Quality. Is the bot handling conversations well? These metrics reveal whether visitors are getting what they came for or abandoning mid-flow. Quality metrics protect the visitor experience and prevent the bot from becoming a lead-repellent.
Tier 3: Business Impact and Pipeline. Is the bot driving revenue outcomes? This is where chatbot evaluation metrics connect to the numbers leadership actually cares about: meetings booked, leads captured, and pipeline influenced.
Tier 4: Data Integrity and Lead Quality. Are the leads captured usable? For B2B teams, a lead without a verified email, correct routing, or ICP match is worse than no lead at all. These chatbot success metrics determine whether chat-sourced leads survive the MQL-to-SQL handoff.
Metric | Tier | What It Measures | B2B Priority |
|---|---|---|---|
Visitor-to-Chat Engagement Rate | Engagement and Adoption | % of visitors who interact with the widget | High |
Chat Volume and Sessions | Engagement and Adoption | Total sessions initiated; baseline for trends | Medium |
Bounce Rate (Chat) | Engagement and Adoption | % who open widget but leave without engaging | High |
Conversation Length | Engagement and Adoption | Avg turns per session; signals resolution efficiency | Medium |
Goal Completion Rate | Resolution and Quality | % who complete a defined action (book, download, resolve) | High |
Deflection Rate | Resolution and Quality | % resolved without human escalation | High |
Automation Rate | Resolution and Quality | % fully handled end-to-end without human involvement | Medium |
Human Takeover Rate | Resolution and Quality | % escalated to a live agent | Medium |
Fallback Rate | Quality and Accuracy | % of queries returning a "don't understand" response | High |
Meeting and Demo Conversion Rate | Business Impact and Pipeline | % of conversations resulting in a booked meeting | High |
Pipeline Influenced | Business Impact and Pipeline | Revenue in pipeline attributed to chat-sourced leads | High |
ICP Match Rate | Data Integrity and Lead Quality | % of captured leads matching target firmographic criteria | High |
Data Completeness | Data Integrity and Lead Quality | % of records with verified email, phone, and company data | High |
Speed-to-Lead After Chatbot Capture | Data Integrity and Lead Quality | Time from lead capture to first human follow-up | High |
Engagement and adoption metrics
These metrics tell you if the bot is getting traction and whether visitors find it worth engaging with. High traffic means nothing if no one clicks the widget or drops off after the first message.
Visitor-to-chat engagement rate
The percentage of website visitors who actively click and interact with the chat widget, based on widget and greeting message clicks.
Formula: (chat widget clicks / total page visitors) x 100
Low engagement signals: Poor bot visibility, irrelevant greeting copy, or bad placement
High engagement signals: The bot is visible and the initial prompt resonates with visitor intent
Chat volume and sessions
Total number of chat sessions initiated. This is your baseline for capacity planning and trend analysis.
Formula: Count of sessions where a visitor sends at least one message
Watch for spikes after campaigns or product launches. Declining volume over time may signal bot fatigue or broken triggers.
Bounce rate
Percentage of visitors who open the chat widget but leave without engaging or entering information. This is different from site bounce rate.
Formula: (widget opens with no visitor message / total widget opens) x 100
High chat bounce rates point to poor greeting messages, bad timing, or irrelevant prompts that do not match visitor intent.
Conversation length
Average number of messages or turns per chat session. Context matters.
Formula: total messages across all sessions / total sessions
Too short: Bot is not helpful or not resolving visitor needs
Too long: Bot is not resolving issues efficiently
Benchmark by use case: A booking bot should be shorter than a troubleshooting bot
Resolution and containment metrics
These metrics reveal whether your chatbot handles tasks end-to-end or just creates handoff friction. The goal is self-service resolution without sacrificing quality.
Goal completion rate
Percentage of users who complete a defined action through the chatbot. This is the north star for chatbot effectiveness.
Formula: (conversations where goal action was completed / total conversations) x 100
Define "goal" clearly based on bot purpose:
Lead gen bots: Book a meeting or demo
Content bots: Download gated assets
Support bots: Resolve inquiry without escalation
Deflection rate
Percentage of inquiries the bot handles without escalating to a human. High deflection saves cost and improves response speed.
Formula: (conversations resolved without human involvement / total conversations) x 100
The balance matters: high deflection only drives value if resolution quality stays high.
A word of caution: Standard containment metrics can actively mislead teams. Your analytics platform may mark a conversation as successfully resolved simply because the user stopped responding, not because their question was answered. Always pair containment rate with CSAT scores from the same conversation cohort to detect false positives.
Automation rate
Percentage of conversations fully handled by the bot without human involvement. Related to deflection rate but focuses on end-to-end automation without any handoff.
Formula: (fully automated conversations / total conversations) x 100
This metric directly impacts cost-to-serve calculations for support teams.
Human takeover rate
Percentage of conversations that require routing to a live agent. This is the inverse view of automation rate.
Formula: (conversations escalated to a human / total conversations) x 100
High rates indicate:
Bot limitations: Scope is too narrow or queries are too complex
Training gaps: Bot needs more conversation data to handle common queries
Poor intent detection: Bot routes to human prematurely
How AI chatbot metrics differ from rule-based chatbot metrics
When teams upgrade from rule-based to AI chatbots, they often carry over the same KPI dashboards. The problem is that those dashboards were designed to measure deterministic systems where every response follows a fixed decision tree. AI chatbot metrics need to capture a different class of failure modes: context drift, hallucination, persona inconsistency, and multi-turn memory loss.
Traditional / Rule-Based Metric | AI / LLM Chatbot Equivalent |
|---|---|
Accuracy | Faithfulness + Groundedness |
Escalation Rate | Role Adherence Score |
Session Completion | Knowledge Retention Across Turns |
Fallback Rate | No-Response Rate + Intent Classification Accuracy |
Evaluating multi-turn AI chatbots requires measuring memory persistence across the full conversation history, not just scoring individual responses in isolation. A chatbot that forgets user context mid-session or breaks its persona across turns fails users even when individual responses score well on quality metrics. Teams that track only single-turn accuracy will miss these failure modes entirely.
When building your AI chatbot metrics framework, treat the traditional metrics as a floor, not a ceiling. The LLM-era equivalents in the right column above capture the failure modes that matter most for enterprise deployments where conversation quality directly affects pipeline outcomes.
Quality and accuracy metrics
High volume means nothing if the bot frustrates visitors with irrelevant or wrong responses. These metrics show whether your bot actually understands what people are asking.
Fallback rate
Frequency with which the bot fails to understand a query and returns a generic "I don't understand" response. High fallback rates signal training gaps or scope issues.
Formula: (conversations triggering a fallback response / total conversations) x 100
A fallback rate above 15% is a strong signal that the knowledge base has coverage gaps requiring immediate attention. Use the top unanswered query clusters as your audit starting point.
Misunderstood query rate
Percentage of queries where the bot responds but misinterprets intent. This differs from fallback rate.
Formula: (queries with confirmed intent mismatch / total queries) x 100
Fallback: Bot admits it does not know
Misunderstood query: Bot gives a confident wrong answer
Misunderstood queries are harder to catch but more damaging to visitor experience. Spot them by reviewing conversation logs for patterns.
Response relevance
Qualitative measure of whether bot responses actually address what the visitor asked. Track this through:
Transcript sampling: Spot-check conversations for relevance patterns
Post-chat feedback: Analyze satisfaction scores by conversation type
Follow-up behavior: Do visitors re-ask or escalate after bot responses
Business impact and conversion metrics
These are the metrics that matter most to revenue leaders because they tie directly to pipeline and customer outcomes. Everything else is a leading indicator. These are the results.
Leads captured
Number of new contacts or leads generated through chatbot conversations. Raw lead count matters less than lead quality, but volume is the baseline.
Track this alongside ICP match rate to understand whether you are capturing the right leads.
ChurnZero, a customer success platform, deployed ZoomInfo Chat to optimize their visitor experience, increasing engagement by 30% compared to their previous vendor.
Meeting and demo conversion rate
Percentage of chatbot conversations that result in a booked meeting or demo. This is the key funnel metric for B2B sales teams.
A high conversion rate signals effective qualification and proper routing logic.
Pipeline influenced
Revenue in pipeline that can be attributed to chatbot-sourced or chatbot-assisted leads. This requires CRM integration and attribution tracking.
Attribution is messy. CRM integration and consistent lifecycle tagging are prerequisites before this metric is meaningful.
Customer satisfaction score (CSAT)
Feedback score from post-chat surveys measuring visitor satisfaction. Typically collected through a quick rating prompt after the conversation ends.
Track CSAT by conversation type to identify which flows work and which frustrate visitors.
Data quality and lead integrity metrics
Capturing a lead means nothing if the record is incomplete, duplicated, or routed to the wrong rep. These metrics connect chatbot capture to actual GTM execution.
Most teams ignore this layer. That is why chatbot leads stall in the funnel.
ICP match rate
Percentage of chatbot-generated leads that match your Ideal Customer Profile criteria. Capturing leads outside ICP wastes sales time.
Track this by comparing chatbot leads against firmographic and technographic filters that define your target market.
For demand gen teams, ICP match rate is the leading indicator of whether chatbot-sourced leads will survive the MQL-to-SQL handoff. A low match rate means sales is spending time on leads marketing should never have captured.
Data completeness
Percentage of chatbot-captured leads that have complete, usable records. Incomplete data creates downstream friction. Essential fields to check:
Email address: Verified and deliverable for outreach
Direct dial: Phone number for immediate sales contact
Company data: Name, domain, industry, and size for segmentation
Role details: Job title and seniority level for routing and messaging
Duplicate rate
Percentage of chatbot-captured leads that already exist in your CRM. Duplicates create confusion and inflate lead counts.
High duplicate rates signal poor CRM matching logic or visitors re-engaging without being recognized.
Route-to-owner accuracy
Percentage of chatbot leads correctly assigned to the right sales rep based on territory, segment, or account ownership. Misrouting costs you: slow follow-up, rep confusion, lost deals.
With ZoomInfo's verified contact and firmographic data, route by:
Territory: Geographic location and regional coverage
Segment: Company size, revenue band, or industry vertical
Specialization: Technology stack or sophistication level
Speed-to-lead after chatbot capture
Time elapsed between chatbot lead capture and first human follow-up. Speed matters for conversion because leads go cold fast.
Track median response time and flag outliers where leads sit untouched for hours or days.
How to improve chatbot performance with better data
Measuring metrics is step one. Moving those numbers requires fixing data quality and workflow breaks. Most chatbot problems trace back to bad data or broken routing logic.
Define clear goals and benchmarks
Teams need to define what "success" looks like before optimizing. Pick 2-3 north star metrics based on use case:
Lead gen bots: Meeting conversion rate and leads captured
Support bots: Deflection rate and CSAT scores
Qualification bots: ICP match rate and speed-to-lead
Identify and fix drop-off points
Review conversation flows to find where visitors abandon. Common culprits:
Too many questions: Reduce form fields to essential data only
Unclear options: Simplify menu choices and response paths
Slow responses: Optimize backend integrations and API calls
Use A/B testing to surface which conversation paths generate the best results. Test greeting copy, question sequencing, and response tone.
Integrate chatbot data with your CRM
Chatbot data should flow into your CRM with proper lifecycle tagging so marketing and sales can track chat-sourced leads through the funnel. When a conversation happens on your website, the chatbot collects that raw data and structures it for your database.
This enables proper lead routing to the right teams based on territory, segment, and account ownership.
Enrich records for segmentation and routing
Enriching chatbot leads with firmographic and contact data enables better routing, scoring, and follow-up. ZoomInfo Chat resolves anonymous visitor sessions to company profiles using IP-to-organization matching across 210M pairings, then enriches records automatically when a visitor provides their email.
Synup deployed automated dynamic chat interactions based on visitor identity and page engagement, generating a tenfold increase in website conversions.
Use enriched data to:
Route accurately: Assign leads to the right rep by territory and segment
Tailor experiences: Customize conversation flows based on company attributes
Track performance: Measure which visitor profiles convert best
Turn chatbot metrics into pipeline with ZoomInfo Chat
Personalized chatbot experiences require an intelligence layer that connects visitor identity, firmographic context, and behavioral signals directly into your GTM tools.
ZoomInfo is an all-in-one AI GTM Platform, and ZoomInfo Chat is its data-powered website chat product, built to turn anonymous visitor traffic into qualified pipeline.
ZoomInfo Chat is built on the industry's most comprehensive B2B data platform: 500M contacts, 120M direct-dial numbers, and 200M+ verified business emails. Visitor identification and lead enrichment happen automatically, without requiring a form fill.
The GTM Context Graph fuses that data with your CRM records, behavioral signals, and conversation intelligence to surface not just who visited, but why they are likely to convert. That reasoning layer is what separates a chatbot that captures leads from one that captures the right leads.
Because ZoomInfo delivers its intelligence through GTM Workspace for sellers, GTM Studio for RevOps and marketers, and APIs and MCP for any custom tool, the signals captured in chat flow into every downstream workflow without manual handoffs.
See ZoomInfo Chat in action, start free and connect visitor intelligence to conversion outcomes.
Frequently asked questions
How do you calculate chatbot ROI?
Compare cost savings plus revenue impact against platform costs. Hard savings include deflected support tickets and reduced agent time. Revenue impact comes from pipeline influenced by chat-sourced leads. The formula is: (cost savings + revenue attributed) / platform cost = ROI multiple. Track both over a 90-day rolling window to account for pipeline lag, since chatbot-sourced leads often take weeks to progress through the funnel.
Which chatbot metrics matter most for B2B lead generation?
Meeting conversion rate, ICP match rate, and speed-to-lead are the three chatbot metrics that connect bot activity directly to pipeline quality. Meeting conversion rate shows whether your qualification logic is working. ICP match rate shows whether the bot is capturing the right leads. Speed-to-lead shows whether the handoff to sales is fast enough to convert intent into a conversation. For a concrete example of chatbot engagement impact, see how ChurnZero increased engagement by 30% after deploying ZoomInfo Chat.
How should chatbot data integrate with your CRM?
Chatbot leads should sync to the CRM with source attribution, lifecycle stage tag, and enriched firmographic data. This requires a native integration or webhook that fires on conversation completion. Without lifecycle tagging, chat-sourced leads are indistinguishable from other inbound sources and attribution breaks down. Pairing that integration with solid data cleansing and structuring ensures records are usable when they arrive.
What is a good chatbot conversion rate for B2B?
B2B chatbot conversion benchmarks vary by use case. For meeting-booking bots on high-intent pages, a 10-20% visitor-to-meeting rate is a reasonable target. For general qualification bots, 3-8% is more typical. The more important benchmark is your own baseline: measure your current rate, set a 90-day improvement target, and use A/B testing on greeting copy and question sequencing to move the number. Chasing an industry average without establishing your own baseline first is a common chatbot metrics mistake.
How do you measure chatbot lead quality?
Lead quality from chatbots is measured through three filters: ICP match rate (do captured leads match your target firmographic and technographic criteria?), data completeness (do records have verified email, direct dial, and company data?), and MQL-to-SQL conversion rate (do chat-sourced leads survive the handoff to sales?). Teams that define these quality thresholds before deploying a chatbot avoid the common failure mode of capturing high volumes of leads that sales immediately disqualifies.