
What is customer lifetime value (CLV)?
Customer lifetime value (CLV) is the total revenue a business expects to generate from a customer across the entire relationship. It is calculated by multiplying customer value by average customer lifespan, where customer value equals average purchase value times purchase frequency.
The simplest CLV formula: Customer Value × Average Customer Lifespan.
CLV comes in two forms. Historic CLV measures actual revenue already generated from a customer. Predictive CLV estimates future value based on behavioral patterns, intent signals, and historical data. For B2B SaaS businesses, a third variant applies: (ARPA × Gross Margin %) ÷ Churn Rate, which accounts for the recurring revenue dynamics that make subscription models structurally different from transaction-based ones.
CLV is sometimes used interchangeably with LTV (lifetime value). In most B2B contexts, they refer to the same metric. The distinction worth keeping in mind: some practitioners use LTV for revenue-only calculations and CLV for gross-margin-adjusted versions. When comparing figures across teams, confirm which formula is in use.
The metric tells you which customers are worth keeping and how much you can spend to acquire new ones.
Why customer lifetime value matters for B2B revenue teams
In B2B, the post-sales cycle is longer and more value-determinative than the sales cycle itself. A new logo closed this quarter may generate most of its total revenue over the next three to five years through renewals, expansions, and cross-sells. That makes CLV primarily a post-sale operations problem, not a marketing metric.
According to Salesforce's State of Sales report, 42% of sales leaders cite recurring revenue as their top revenue source. That share of revenue is almost entirely determined by what happens after the contract is signed.
CLV shapes how revenue teams allocate resources and prioritize accounts. Here is what it enables:
Budget allocation: Determines the spend split between new logos and existing accounts
Account prioritization: Identifies which customers warrant more attention and proactive investment
Team alignment: Gives sales, marketing, and CS a shared metric that connects acquisition cost to long-term value
Forecasting: Supports revenue predictions and planning grounded in actual customer behavior
Without CLV, you are guessing at which accounts matter most. With it, you can direct effort where it generates the most return.
How to calculate customer lifetime value: formulas and models
You do not need a graphing calculator to find CLV, but it requires clean customer data and a clear model. The right formula depends on your business model. The table below compares the three most common approaches.
Model | Formula | Data Required | Best Fit Business Type |
|---|---|---|---|
Simple Historical | Customer Value × Avg Customer Lifespan | Purchase history, tenure | Transaction-based, professional services |
Gross-Margin-Adjusted | ARPA × Gross Margin % ÷ Churn Rate | ARPA, COGS, churn rate | B2B SaaS, subscription businesses |
Predictive | Behavioral signals + historical patterns → forecast | Intent data, usage data, CRM history | Enterprise SaaS, complex B2B with long cycles |
Before you start calculating, gather these data points:
Average purchase value: Total revenue divided by number of orders
Purchase frequency: Number of orders divided by unique accounts
Customer lifespan: Average tenure in years or months
For SaaS models: ARPA, gross margin percentage, and churn rate
The basic CLV formula
The basic formula has two components:
CLV formula: Customer Value × Average Customer Lifespan
Customer Value: Average Purchase Value × Purchase Frequency
Average purchase frequency is your total number of orders placed by all or multiple accounts, divided by the number of unique accounts.
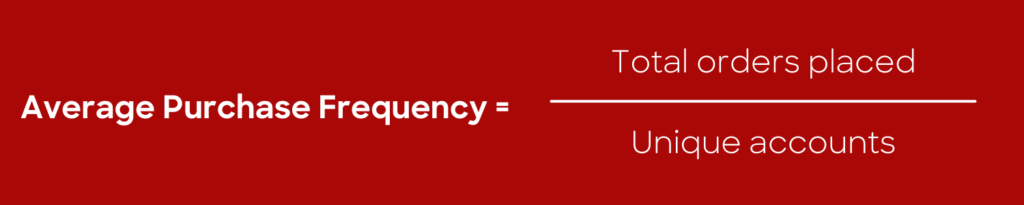
If 150 customers placed 500 orders total, divide 500 by 150 to get 3.333 orders per customer.
Average sale value is your company's total revenue from all or multiple accounts (or an individual account), divided by the number of orders placed by them.
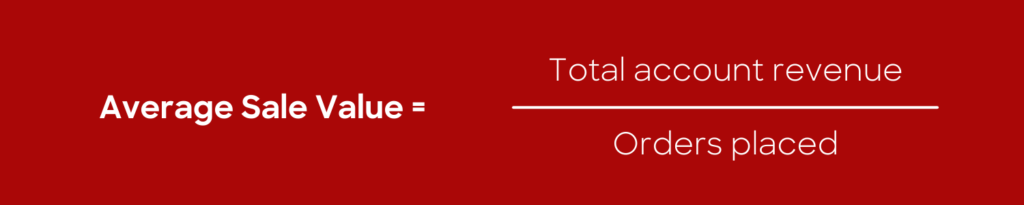
If your revenue is $3 million from 500 orders, divide 3,000,000 by 500 to get $6,000 per order.
Customer value is your average sale value multiplied by your average purchase frequency.
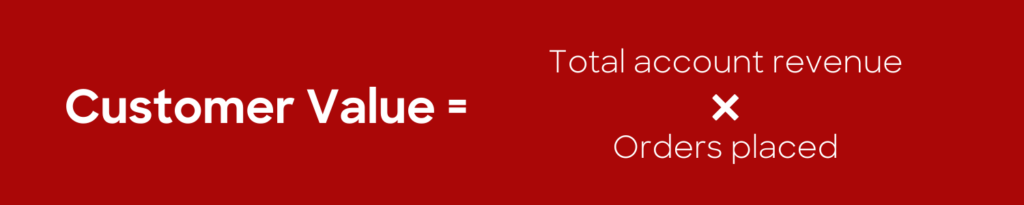
Multiply 6,000 by 3.333 to get 19,998 in customer value. Average lifespan is the average time customers stay with your company. Any digital tool with advanced analytics (like a CRM) can display this data.
For this example, assume your average customer lifespan is 3.2 years. Customer lifetime value is your customer value multiplied by average lifespan.
19,998 × 3.2 = $63,995 CLV
SaaS customer lifetime value formula
Subscription businesses use a different approach: CLV = (ARPA × Gross Margin %) ÷ Churn Rate. This formula accounts for recurring revenue models where customers pay monthly or annually.
The three inputs are:
ARPA (Average Revenue Per Account): Monthly or annual revenue divided by number of accounts
Gross Margin: Revenue minus cost of goods sold, expressed as a percentage
Churn Rate: Percentage of customers lost per period
Use this formula when you have predictable recurring revenue and can measure churn accurately. The basic formula works better for transaction-based models.
A critical caveat for finance and operations practitioners: revenue-only CLV formulas produce systematically misleading results. Using gross revenue instead of gross margin overstates CLV for low-margin customers, sometimes dramatically. Any strategic decision based on CLV, where to invest in retention, which customer segments to prioritize, what CAC is justified, should use the gross-margin-adjusted formula.
Predictive CLV
Predictive CLV moves beyond historical averages to forecast the future value a customer is likely to generate. Rather than calculating what a customer has been worth, predictive models estimate what they will be worth, using behavioral signals, intent data, and historical patterns as inputs.
For B2B teams, the most useful predictive signals include product usage trends, engagement frequency, organizational changes (new hires, funding rounds, acquisitions), and third-party intent data showing when accounts are actively researching adjacent solutions. A customer who has expanded headcount by 30% and is showing intent signals for a complementary product category is a very different CLV forecast than their historical average suggests.
Predictive CLV is particularly valuable for account management and CS teams managing large books of business. Rather than treating all accounts as equally likely to renew or expand, predictive models let you rank accounts by expected future value and concentrate retention investment where it will have the most impact.
CLV calculation examples
Example 1: Multiple subscription accounts. Your revenue is $3 million from 150 customers who placed 500 orders total. Average customer lifespan is 3.2 years.
Average purchase frequency: 500 ÷ 150 = 3.333
Average sale value: 3,000,000 ÷ 500 = $6,000
Customer value: 6,000 × 3.333 = $19,998
CLV: 19,998 × 3.2 = $63,995
Example 2: Individual enterprise account with expansion. One customer generated $150,000 in revenue across 45 orders over 2 years.
Average sale value: 150,000 ÷ 45 = $3,333
Purchase frequency: 45 orders ÷ 2 years = 22.5 per year
Customer value: 3,333 × 22.5 = $74,992 annually
CLV (2-year tenure): 74,992 × 2 = $149,984
Key metrics for calculating CLV in B2B
Accurate CLV depends on reliable inputs. Garbage data produces garbage results.
Here are the metrics that drive CLV calculations and where to find them:
Metric | Definition | Typical Data Source |
|---|---|---|
ARPA | Average revenue per account per period | Billing/Finance |
Gross Margin | Revenue minus cost of goods sold | Finance |
Churn Rate | Percentage of customers lost per period | CRM/CS |
Customer Lifespan | Average tenure in years or months | CRM |
Most B2B companies pull this data from multiple systems. Your CRM holds account history and tenure. Billing systems track revenue and contract terms. Finance calculates margins.
The challenge is not the math. It is getting clean, consistent data from each source.
What is a good CLV:CAC ratio?
CLV matters most when compared to Customer Acquisition Cost (CAC). The ratio tells you whether your unit economics work.
The 3:1 benchmark is a widely cited industry guideline, though it is an approximation rather than a precise target. The right ratio depends on your gross margin, sales cycle length, and growth stage. A capital-efficient SaaS business might target 4:1 or higher; an early-stage company investing heavily in growth might operate at 2:1 intentionally for a period.
Business Type | Typical CLV:CAC Target | Notes |
|---|---|---|
B2B SaaS | 3:1 or higher | Standard benchmark for healthy unit economics |
Professional Services | 2:1 or higher | Lower margin tolerance; longer sales cycles |
General B2B | 3:1 or higher | Widely cited starting benchmark |
Here is what different ratio ranges mean in practice:
Below 1:1: Spending more to acquire customers than you will ever earn back, unsustainable unit economics
1:1 to 3:1: Covering costs but with limited margin for growth investment
3:1 or higher: Healthy unit economics with room to scale
How to increase customer lifetime value in B2B
Building closer relationships with current customers is the foundation of maximizing CLV. This requires sales and marketing teams to prioritize retention strategies alongside acquisition. The right B2B customer loyalty tools can help teams systematize these efforts and reduce churn at scale.
CLV should be understood as a measure of customer engagement and commitment, not just historical spend. Product adoption and renewal behavior are stronger predictors of future value than past revenue alone. An account that has expanded usage, completed onboarding, and integrated your product into their core workflow is a fundamentally different CLV story than one that has paid the same invoices but never fully adopted.
The three most effective levers for increasing CLV in B2B are reducing churn, growing expansion revenue, and improving acquisition targeting from the start.
Reduce churn and extend customer lifespan
Retention directly impacts customer lifespan, which drives CLV. Lose customers faster, and your CLV drops.
Research by customer-retention expert Ali Cudby finds that a 5% increase in retention can yield a profitability improvement of 25% or more. That asymmetry makes retention investment one of the highest-ROI activities available to a B2B revenue team.
Effective B2B retention starts before renewal conversations. Proactive customer success teams monitor account health and address issues early. Regular business reviews keep stakeholders engaged. Usage and adoption metrics reveal which accounts need attention.
Watch for these warning signs that an account may churn:
Declining usage or login frequency
Increase in support complaints
Key stakeholder turnover
Delayed responses to outreach
Budget cuts or reorganizations
Catching these signals early gives you time to intervene before the renewal deadline.
Increase expansion revenue and average order value
Expansion revenue increases CLV by raising ARPA. Selling more to existing customers often costs less than acquiring new ones.
The best expansion opportunities come from accounts already seeing value. Look for these buying signals:
Department hiring: New headcount in teams using your product signals growth
Funding or revenue growth: Fresh capital creates budget for expansion
Technology changes: New tools that complement your solution open doors
Team growth: More users mean more seats or higher-tier plans
Usage patterns: Heavy adoption indicates readiness for advanced features
Timing matters. Push too early and you risk the relationship. Wait too long and competitors fill the gap.
Improve acquisition targeting for higher-CLV customers
The customers you acquire today determine the CLV distribution you manage tomorrow. Acquiring higher-fit customers produces higher CLV from day one, not because you have done anything differently post-sale, but because the right customer achieves faster time-to-value, expands more naturally, and churns less.
Higher-CLV acquisition starts with a precise ICP definition grounded in firmographic and technographic data. Which company sizes, industries, and technology stacks correlate with your highest-CLV cohorts? Which acquisition channels bring in customers who renew at the highest rates? Answering these questions with actual data rather than assumptions lets you shift acquisition spend toward the segments that generate the most long-term value.
For CLV marketing purposes, this means aligning campaign targeting and lead scoring with the characteristics of your best existing customers, not just the companies most likely to convert in the short term.
Common challenges in measuring CLV accurately
CLV is a powerful metric, but it is only as reliable as the data and models behind it. These four challenges are the most common sources of measurement error in B2B.
Data availability gaps across systems. CLV requires clean, synchronized data from CRM, billing, and product usage systems that are rarely in sync in practice. A customer's tenure might live in the CRM, their revenue in the billing system, and their usage in a separate product analytics tool. When these sources disagree, your CLV calculation is wrong before you start. The mitigation: establish a single source of truth with a regular enrichment cadence so all three data sources stay current and consistent.
Revenue-only formulas overstate CLV for low-margin customers. Using gross revenue instead of gross margin in your CLV calculation produces a number that looks healthy but masks the real economics. A customer generating $200K in annual revenue at 30% gross margin is worth significantly less than one generating $150K at 70% gross margin. Any strategic decision based on CLV, retention investment thresholds, CAC targets, account prioritization, should use the gross-margin-adjusted formula.
Predictive model overfitting when customer behavior shifts. Predictive CLV models trained on historical data can fail when market conditions, product mix, or customer behavior changes. A model built on pre-2023 renewal patterns may not reflect current churn dynamics. The mitigation: recalibrate predictive models quarterly and validate predictions against actual renewal outcomes. If the model consistently over- or underestimates a segment, the training data is stale.
Single average CLV masks your actual distribution. A single average CLV number hides the fact that your customer base is almost certainly bimodal or heavily skewed. Your top 25% of accounts may generate 70% or more of your total revenue. Managing to an average treats high-CLV and low-CLV accounts as equivalent, which leads to both underinvestment in your best accounts and overinvestment in accounts that will never generate meaningful returns. The mitigation: segment customers by CLV quartile to identify the behaviors and characteristics of your highest-value cohort, then replicate those conditions in acquisition and onboarding.
CLV segmentation: analyzing your customer base by value tier
A single average CLV is a useful summary statistic and a poor operational tool. For enterprise and mid-market teams managing named accounts with widely variable contract sizes, industries, and usage patterns, the average obscures more than it reveals.
The accounts in your top quartile behave differently from accounts in your bottom quartile. They expand more frequently, they engage with QBRs more consistently, they have deeper product adoption, and they are more likely to provide references. Managing all accounts to the same playbook means your highest-value accounts are underserved and your lowest-value accounts consume resources they will never justify.
Quartile segmentation breaks your customer base into four tiers from highest to lowest CLV. Each tier gets a differentiated investment level and a distinct set of risk signals to monitor.
CLV Tier | Typical Characteristics | Recommended Investment Level | Key Risk Signal |
|---|---|---|---|
Top 25% | Multi-year tenure, high ARPA, deep product adoption, multiple stakeholders engaged | High: dedicated CSM, proactive EBRs, executive sponsorship | Champion departure, competitive evaluation signal, usage plateau |
Upper-Mid 25% | 1-3 year tenure, moderate ARPA, growing adoption, 1-2 key stakeholders | Medium-High: regular check-ins, expansion plays, health scoring | Declining usage, support ticket spike, delayed renewal response |
Lower-Mid 25% | Under 2 years, lower ARPA, partial adoption, single stakeholder | Medium: onboarding completion focus, value realization programs | Low feature adoption, no QBR attendance, single point of contact |
Bottom 25% | Short tenure, lowest ARPA, minimal adoption, reactive engagement only | Low: scaled digital programs, automated health alerts | Any engagement drop, missed check-ins, competitor research signals |
The practical implication: high-CLV accounts warrant proactive CS investment because the cost of churn is high and the upside from expansion is real. Low-CLV accounts may not justify the same spend, but they should not be ignored entirely. The goal is to identify the behaviors and characteristics that define your top quartile and build acquisition, onboarding, and expansion programs that move more accounts toward that tier over time.
Average customer lifetime value across your full book of business is a useful board-level metric. CLV by tier is the operational tool that drives actual retention and expansion decisions.
How to operationalize CLV for B2B revenue teams
Calculating CLV is step one. Using it to drive decisions is where the value lives.
B2B buying is committee-based, which means you need both account-level and contact-level CLV. Account-level CLV shows total relationship value. Contact-level CLV reveals which stakeholders drive the most revenue.
RevOps teams need data from multiple sources to calculate and act on CLV:
CRM: Account records, deal history, renewal dates
Billing: Revenue, contract terms, expansion events
Product usage: Adoption metrics, feature engagement
Support: Ticket volume, satisfaction scores
CRM-based CLV tracking
For most B2B teams, the CRM is the operational home for CLV data. A well-configured CRM surfaces customer lifespan data, tracks renewal dates, and stores the account history that makes CLV calculations possible. The challenge is keeping that data current.
CRM data degrades quickly. Contacts change roles, companies restructure, and contract terms evolve in ways that are not always captured in the system. Account managers who rely on stale CRM data walk into renewals with the wrong picture of the account. A CRM implementation that includes regular data enrichment cadences keeps CLV inputs reliable and ensures the account history driving your calculations reflects reality.
The most effective CRM-based CLV setups pull enriched contact and company data automatically, flag when key fields go stale, and integrate with billing and product usage systems so account health is visible in a single view.
Operationalizing predictive CLV with intent signals
Predictive customer lifetime value becomes actionable when you connect it to behavioral data in real time. Intent signals, organizational change alerts, and usage data feed predictive models with the leading indicators that historical CLV calculations cannot capture.
An account showing declining product usage, a recent champion departure, and third-party intent signals around competitor research is a very different predictive CLV story than their historical spend suggests. Conversely, an account that has grown headcount by 40%, recently received funding, and is showing intent signals for adjacent product categories has a higher predictive CLV than their current ARPA implies.
ZoomInfo's firmographic data reveals which accounts fit your ideal customer profile. Technographic data shows which technologies they use. Intent signals from the GTM Context Graph indicate when accounts are ready to buy more. Combining these signals with CRM-based CLV calculations shifts account management from reactive triage to proactive prioritization.
How ZoomInfo helps revenue teams act on CLV intelligence
ZoomInfo is an all-in-one AI GTM Platform that helps account management and customer success teams surface churn risk, expansion signals, and buying-group changes before they show up in your CRM. The platform is built on three interconnected capabilities: a comprehensive B2B data foundation, an intelligence layer that reasons across signals, and access lanes that deliver that intelligence wherever your team works.
The data foundation covers 500M contacts, 100M companies, and 135M+ verified phone numbers. For account management and CS teams, that scale matters because CLV calculations are only as accurate as the contact, firmographic, and technographic data feeding them. Stale CRM data produces misleading CLV inputs. ZoomInfo's continuous verification keeps the account data underlying your CLV models current, so the numbers you use for retention investment decisions reflect what is actually happening in your accounts.
The GTM Context Graph processes 1.5B+ data points daily, fusing CRM records, conversation intelligence from Chorus, and behavioral signals into a unified reasoning layer. For CLV specifically, the Context Graph surfaces the leading indicators of CLV change before they become visible in lagging metrics: churn risk signals, expansion readiness, and buying-group shifts that precede renewal conversations by weeks or months. This is the intelligence layer that shifts account management from reactive to proactive. Instead of learning about a competitive evaluation from a non-renewal notice, account managers see the signals that precede it.
Account managers and CS teams access this intelligence through GTM Workspace, where AI agents surface prioritized accounts and recommended actions. RevOps and marketing teams build and activate retention and expansion plays in GTM Studio, or pipe the same intelligence into any existing tool via APIs and MCP. Thomson Reuters achieved a 40% increase in closed-won deals and 115% average monthly quota attainment using ZoomInfo, an outcome that reflects what happens when account teams have the right signals at the right time.
Request a demo to see how ZoomInfo's GTM Context Graph surfaces CLV signals before they become churn events.
Frequently asked questions about customer lifetime value
What is a good customer lifetime value for B2B SaaS?
There is no universal "good" CLV, it depends on your CAC, gross margin, and business model. The most useful benchmark is the CLV:CAC ratio: B2B SaaS companies typically target 3:1 or higher, meaning each customer generates at least three times what it cost to acquire them. For SaaS, a CLV below your CAC signals unsustainable unit economics regardless of the absolute dollar figure.
How do you calculate customer lifetime value for subscription businesses?
For subscription businesses, use the gross-margin-adjusted SaaS formula: CLV = (ARPA × Gross Margin %) ÷ Churn Rate. ARPA is your average revenue per account per period; gross margin removes cost of goods sold; churn rate is the percentage of customers lost per period. This formula accounts for recurring revenue dynamics and produces more accurate results than revenue-only calculations, which overstate CLV for low-margin customers.
Is customer lifetime value the same as LTV?
CLV and LTV (lifetime value) are often used interchangeably, and in most B2B contexts they refer to the same metric: the total revenue or profit a business expects from a customer over the full relationship. Some practitioners use LTV to refer to the revenue-only calculation and CLV to refer to the gross-margin-adjusted version, but there is no universal standard. When comparing CLV figures across teams or vendors, confirm which formula is being used.
How can account managers use CLV to prioritize their book of business?
Account managers can segment their book of business by CLV tier, high-CLV accounts with declining usage or engagement signals warrant immediate proactive outreach, while low-CLV accounts with growth potential need nurturing. Signal-based prioritization (intent data, org change alerts, usage drops) replaces gut-feel triage and ensures the highest-value accounts get attention before renewal conversations, not after. ZoomInfo's GTM Workspace surfaces these signals automatically so account managers can act on the right accounts at the right time, as demonstrated by Thomson Reuters' closed-won lift of 40% and 115% average monthly quota attainment.
How does churn rate affect customer lifetime value?
Churn rate is the most direct lever on CLV. In the SaaS formula (ARPA × Gross Margin % ÷ Churn Rate), even a small reduction in churn rate produces a disproportionate increase in CLV, because CLV is inversely proportional to churn. A company with 5% monthly churn has an average customer lifespan of 20 months; reducing churn to 3% extends average lifespan to 33 months, increasing CLV by 65% with no change in revenue per account. This is why retention investment typically delivers higher CLV ROI than acquisition investment.