
What is a total addressable market?
Your total addressable market (TAM) is the theoretical ceiling of revenue your product or service could generate if it captured 100% market share. Think of it this way: TAM is the size of the entire pie before anyone takes a slice. It is expressed in total revenue potential or total number of potential customers, and it represents the broadest possible universe of accounts that could ever buy from you.
TAM is not a forecast or a revenue target. It is a planning input, a way to size the opportunity before you decide how to pursue it. For go-to-market teams, a well-defined TAM anchors every downstream decision, from budget allocation to market intelligence data strategy to investor communication.
Within that total universe, two narrower tiers help teams translate the big number into something actionable. Your Serviceable Addressable Market (SAM) is the portion of TAM your current GTM motion and geographic coverage can realistically reach. Your Serviceable Obtainable Market (SOM) is the realistic slice of SAM you can capture given your current sales capacity and competitive position. The full TAM/SAM/SOM framework is covered in the next section.
TAM, SAM, and SOM: what is the difference?
The three sit inside each other. TAM is every account that could ever buy. SAM removes the ones your pricing, packaging and supported geographies cannot serve today. SOM is what your current headcount and win rate can close in twelve months. If your SOM comes out anywhere near your SAM, the two were built separately and one of them is wrong. All three tiers matter for GTM planning because each one answers a different question: how big is the total opportunity, how much of it can we reach, and how much can we realistically win? Using all three together prevents the common mistake of treating the total market as a revenue target.
Metric | Definition | Formula | Example (B2B HR tech startup) |
|---|---|---|---|
TAM (Total Addressable Market) | Total revenue opportunity if you achieved 100% market share globally | Total potential customers × ARPU | 500,000 companies globally that could use HR software × $5,000 ACV = $2.5B |
SAM (Serviceable Addressable Market) | The segment of TAM your current GTM motion and geographic reach can serve | TAM × % of market your product/team can realistically serve | 80,000 US-based SMB and mid-market companies in your supported verticals × $5,000 ACV = $400M |
SOM (Serviceable Obtainable Market) | The realistic near-term portion of SAM you can capture given competitive density and sales capacity | SAM × realistic market share % | 5% of SAM = $20M near-term pipeline target |
The distinction between these three tiers has direct operational consequences. SAM is what your current campaigns and sales plays can actually reach, so it is the right input for channel planning and marketing strategy. SOM is what your annual pipeline target should be built against, because it accounts for the competitors already in the market and the accounts your team has the capacity to work. Treating your TAM as your pipeline target is one of the most common and costly mistakes in GTM planning.
For ABM and demand gen teams, the framework also shapes how you define your ideal customer profile. Once you know your SAM, you can break it into micro-segments by industry, headcount, and geography to identify where you win most often and where to concentrate your first campaign waves.
Is TAM the same as market size?
They answer different questions. Market size is what buyers spend in a category today. TAM is what they would spend with you if you had no competitors and no coverage gaps. The two diverge in both directions, so swapping one for the other in a board deck will get you caught.
TAM runs larger than current market size when your product reaches buyers the category does not serve yet. Those buyers spend nothing today, so they appear nowhere in the category figure. TAM runs smaller when the published category number bundles in adjacent products you do not sell. A published figure for the global HR software market includes payroll processing, and a company selling only applicant tracking has to strip that out before the number means anything.
Analyst market-size reports are a fine top-down starting point. They are not a TAM. That filtering step, from category spend down to accounts matching your ICP, is what turns a market size into a TAM.
How to calculate your total addressable market
Calculating TAM starts with a clear formula, then the method you choose determines how reliable the output is.
TAM Formula: TAM = Total Potential Customers × Average Revenue per Customer (ARPU)
Three approaches exist for calculating TAM, and the right choice depends on how much first-party data you have and how mature your market is.
1. Top-down approach
The top-down approach starts with a published industry figure from an analyst firm like Forrester or Gartner, then applies segment filters to narrow it down to your ICP. Think of it as an inverted pyramid: you start with the broadest market estimate and carve away the segments that do not match your criteria.
For a B2B HR tech startup, you might start with a published figure for the global HR software market, then filter to US-based companies with 50-500 employees in your target verticals.
The limitation: external analyst reports may not align precisely with your ICP definition, and their segment boundaries can add or remove accounts in ways that make your estimate less reliable.
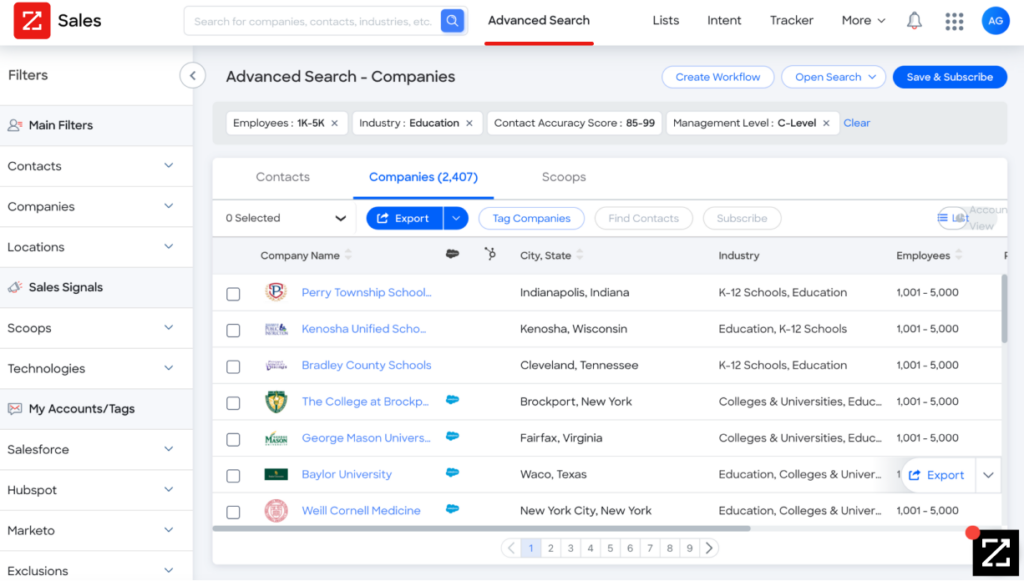
Using ZoomInfo's AI GTM Platform to run a top-down TAM analysis involves a few steps:
Define the criteria. Determine firmographic filters for companies and contacts, such as industry/NAICS/SIC codes, employee count, revenue range, and job levels or titles.
Gather data. Pull a list of companies or contacts matching those filters.
Import data. If working from an existing file, import it using the Snowflake import template.
Match and deduplicate. Join the table with the imported file, match records, and remove duplicates.
Analyze and export. Export account counts or a contact sample, confirming the results do not exceed total database coverage.
For a free public cross-check on the account counts, use the US Census Bureau's County Business Patterns. It publishes establishment counts by NAICS code and employment size band for every US county. It will not give you contacts or revenue, and it runs years behind, so treat it as a sanity check rather than a source. It will tell you within minutes whether your platform's count of US companies in a given NAICS band is in the right order of magnitude.
2. Bottom-up approach
The bottom-up approach is more reliable because it uses first-party data rather than third-party estimates. Multiply the total number of ICP-matching accounts by your average contract value (ACV).
For example, suppose you sell lemonade to vendors on the West Coast. You have 1,000 potential vendors, each buying an average of 50 cases per year at $30 per case, for an ACV of $1,500. TAM = 1,000 vendors × $1,500 = $1.5 million.
For the B2B HR tech startup, the same logic applies: identify every company in your target firmographic profile and multiply by your ACV.
You can extract more value from this calculation by segmenting accounts by size. Using the lemonade example: of 1,000 vendors, 659 are SMBs (ACV $500), 166 are mid-market (ACV $2,000), and 175 are enterprise (ACV $5,000). The segmented TAM is ($500 × 659) + ($2,000 × 166) + ($5,000 × 175) = $1,536,500. The unsegmented sum gives you one number. The segmented sum tells you enterprise accounts are 17.5% of the vendor list and 57% of the money. That's the sentence that moves reps.
When this calculation is built on highly accurate data, the output reflects your actual opportunity rather than a rough approximation. For teams building AI-assisted TAM workflows, the GTM Context Graph provides that verified data foundation, connecting ZoomInfo's 100M+ companies and 500M+ contacts to your agents and tools without requiring a new interface.
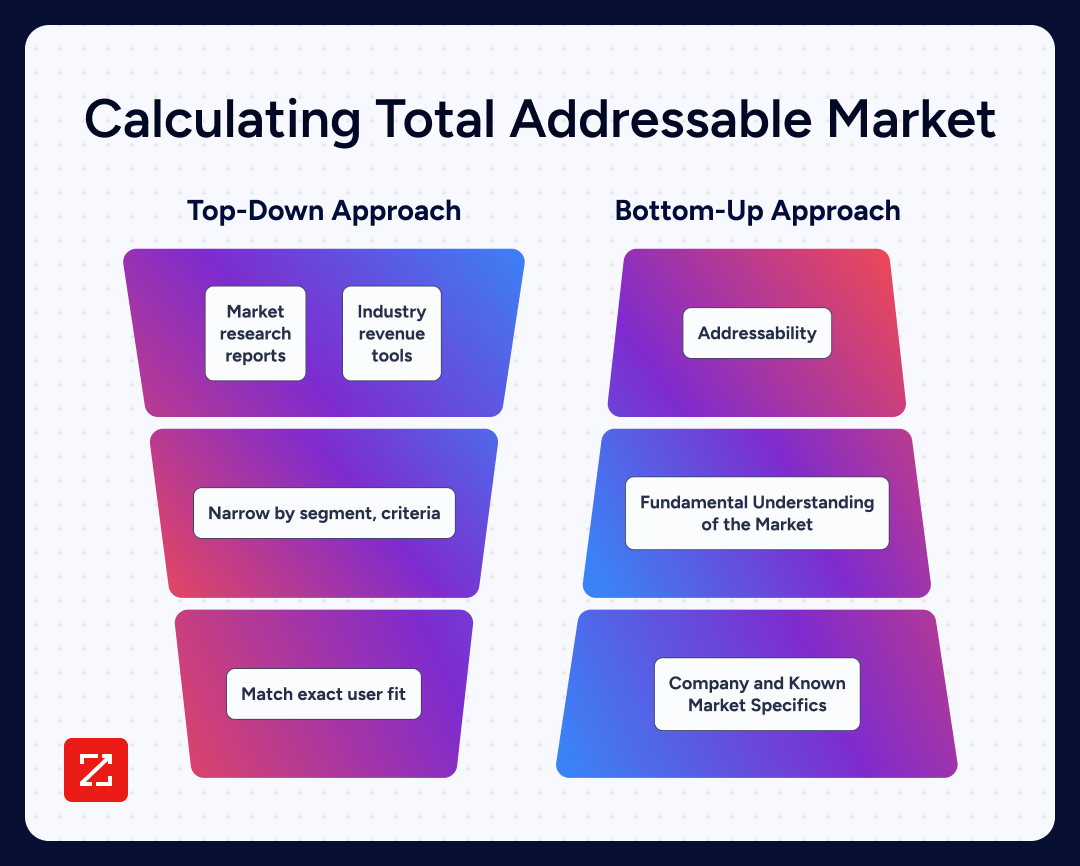


TAM Calculation Components to gather before you start:
Total number of ICP-matching accounts (by firmographic segment)
ACV or ARPU by segment (SMB, mid-market, enterprise)
Geographic scope and coverage constraints
Industry and vertical filters aligned to your GTM motion
3. Value-theory approach
The value-theory approach applies when you are building a product that creates a new category and no historical spend data exists. Instead of starting from existing market size, you start from willingness-to-pay: what would buyers pay to solve this problem, and how many buyers face the problem?
For example, if you are launching a novel AI-powered workflow tool with no direct predecessor, you would survey or interview potential buyers to estimate what they would pay, then multiply by the total population of companies that match the buyer profile. This method is less precise than bottom-up but is the only viable approach when there is no market precedent to anchor the calculation.
Two details decide whether the output is usable. Ask what the buyer spends today on the workaround. Asking what they would pay for your product gets you a compliment, not a number. Interview enough people that one enthusiastic buyer cannot swing the average. In practice that means 20 to 30 conversations spread across your segment bands, not five with your friendliest design partners.
Ready to try it yourself?
The ZoomInfo TAM Calculator is a free resource that lets any GTM professional run a TAM analysis in minutes using live firmographic data.
Common TAM calculation mistakes to avoid
Even well-resourced teams make these four mistakes. Catching them early prevents the downstream problems they cause in budgeting, forecasting, and stakeholder communication.
Confusing TAM with SAM or SOM. Treating your total market as your reachable market inflates revenue projections and misleads stakeholders about what your team can actually pursue. Fix: always label which tier you are presenting and be explicit about the assumptions behind each number.
Relying only on top-down estimates without bottom-up validation. Analyst report figures may not match your actual ICP, and their segment definitions rarely align perfectly with your firmographic filters. Fix: cross-validate every top-down estimate with a bottom-up calculation using your own data against your specific ICP criteria.
Treating TAM as static. Markets shift as competitors enter, regulations change, and buyer behavior evolves. A TAM calculated two years ago may significantly overstate or understate your current opportunity. Fix: recalculate TAM annually and after major market events such as a new category entrant, a regulatory change, or a significant shift in buyer behavior.
Ignoring competitive density within the TAM. A $10B TAM with 200 well-funded competitors is less attractive than a $1B TAM with three. Raw market size without competitive context produces a misleading picture of the opportunity. Fix: layer competitive analysis alongside your TAM figures to assess how much of the market is genuinely contestable.
A well-constructed TAM is only as reliable as the data and assumptions behind it. The number itself is just the starting point.
What a $100 billion TAM miss looks like in practice
The most instructive TAM argument on record was conducted in public, by two people who were both good at the math.
In June 2014, NYU finance professor Aswath Damodaran published his valuation of Uber. He sized the global taxi and limo market at $100 billion, gave Uber a plausible share of it, and arrived at a base case of $5.895 billion. Investors had priced the round at $17 billion six days earlier.
On July 11, 2014, Benchmark partner Bill Gurley answered him at Above the Crowd. Gurley did not dispute the arithmetic. He disputed the input. Sizing Uber against the existing taxi market assumed the future market would look like the past one. Shorter waits, coverage outside city centers and lower prices through higher vehicle utilization would pull in trips that had never been taxi trips at all. Gurley put it bluntly: the core assumptions in the analysis could be off by a factor of 25, perhaps more.
Uber went public on May 9, 2019 at $45 a share, a valuation of roughly $82 billion.
Damodaran's method was sound, and his transparency about it is why the exchange is still worth reading. What his number inherited was the category boundary as the analyst had drawn it. That's the risk in every top-down TAM. For most B2B software companies selling into an established category the boundary holds and top-down works fine. If your product changes who can buy, or how often, the published category number is the wrong denominator. Only a bottom-up count of accounts will tell you the truth.
What makes a good total addressable market?
There is no universal threshold. What counts as a good TAM depends entirely on your business stage, funding model, and GTM motion.
For VC-backed startups, investors commonly look for a TAM of at least $1 billion to justify venture-scale returns. Treat that as a widely cited investor heuristic rather than a sourced statistic. It reflects the return math venture funds require. A smaller TAM makes it structurally difficult to build the kind of company that returns a fund.
For bootstrapped or SMB-focused businesses, a $50 million to $200 million TAM can be highly attractive if competitive density is low and margins are strong. A tightly defined, well-understood market with few competitors is often more valuable than a large, contested one.
For enterprise GTM teams, the most relevant question is not absolute TAM size but SAM coverage: what percentage of your reachable market is your current pipeline actually touching? A team with a $500 million SAM and 10% pipeline penetration has more near-term opportunity than a team with a $5 billion TAM and 0.5% penetration.
Business stage | Typical TAM threshold | Key qualifier |
|---|---|---|
VC-backed startup | $1B+ | Must support venture-scale returns |
Bootstrapped / SMB-focused | $50M-$200M | Low competitive density, strong margins |
Enterprise GTM team | Varies | SAM coverage and pipeline penetration matter more than total size |
The quality of your TAM estimate matters as much as the size. A precisely calculated $500 million TAM built from first-party firmographic data is more actionable than a loosely estimated $5 billion figure pulled from an analyst report.
How to use TAM in strategic planning and resource allocation
A TAM number that lives only in a fundraising deck has done nothing for you. It pays for itself in the annual budget split and in the quarterly argument about which segments get dedicated plays. Each wants a different tier. The common failure is bringing SOM to a board that asked for TAM, or TAM to a planning session that needed SOM.
Communicate market potential to investors and leadership
At the highest level, a well-calculated TAM helps your company explain its potential to investors, employees, and other key stakeholders. Investors and external partners want to know your company's ambitions and understand the C-suite's goals, but they also need to know that the math backs it up.
Inside the company, a well-formulated TAM guides your team toward a shared goal and gives everyone a common gauge of how close they are to capturing a meaningful slice of the market.
Demonstrating to investors and partners that your strategies are supported by rigorous TAM calculations increases their trust in your business. Show the account count and the ACV assumption on the same slide as the total. The first question in the room is always which of the two you inflated.
Publishing the SOM figure internally gives sales, marketing and finance one denominator to argue against, instead of three.
Guide budget allocation and prioritize market segments
At a more granular level, a well-considered TAM calculation can help guide your budgeting and investment decisions for better resource allocation. Once your TAM is defined, your marketing teammates will know which segments of the market to focus on next and will have a clearer understanding of how their efforts are translating into bottom-line results.
Understanding TAM allows you to prioritize spending on marketing and sales initiatives that target the most lucrative market segments. For ABM campaign planning specifically, TAM segmentation by industry, headcount, and geography tells you which audiences deserve dedicated plays versus broad nurture.
Segment-level TAM also exposes concentration risk. If 60% of your reachable revenue sits in one vertical, a single regulatory change there is a company-level event. That belongs in the budget conversation, not the risk register.
Knowing your TAM improves the accuracy of your sales forecasts by providing a clearer picture of potential market penetration and growth, supporting better financial planning.
Sizing tells you the market exists. Capacity planning tells you whether you have the seats to work it, and that is the step teams skip. Territories get drawn, quota gets set against raw headcount, and in Q3 somebody finds the math never priced in two open reqs and a rep who left in February. I went into this properly in our guide to sales capacity planning. Your SOM is the input it runs on.
Identify your ICP within the TAM
How can you know which segments within your TAM have the highest revenue potential? An accurate view of your TAM answers that question directly. If you want to get specific with the nuances of your TAM, the right TAM data can tell you:
The ideal customer profile within your total addressable market
The total addressable market of business professionals for your products or services
The ideal persona profile of business professionals within your total addressable market
For demand gen teams, micro-TAM breakdowns by industry and headcount are particularly valuable: they reveal which segments you win in most often, which lets you prioritize which audiences to activate first rather than spreading budget evenly across the entire SAM.
Once TAM is defined, the next step is activating against it. Knowing the size of your market is only useful if you can identify which accounts within it are worth pursuing now, which channels to use, and how to sequence your outreach. That is where GTM execution picks up where market sizing leaves off.
Where to get accurate data for your TAM analysis
To identify companies in your TAM, use your B2B database to filter by industry, company size, and location. You should have enough filters to narrow in on a target market, but not so many that your market opportunities become too small. Choosing the right tools for this filtering work matters: a review of leading market intelligence tools can help you evaluate which platforms give you the firmographic depth your TAM analysis requires.
Stale or inaccurate firmographic data produces a TAM that misrepresents your actual opportunity, which is why data freshness is a foundational requirement. If the underlying records have not been updated recently, your account counts will include companies that have changed size, shifted industry, or gone out of business entirely. Only 19% of companies believe their data is AI-ready. A TAM built on records nobody trusts enough to feed an agent is not a number to build a hiring plan on.
To prioritize which accounts to target first, break down your TAM into micro-TAMs based on industry and headcount. Now you can see where you win big and often, compared to markets with smaller deal sizes and higher loss rates.
For example, you may win more with small-to-midsize healthcare companies than with enterprise financial companies.

"Company ID is transformational. It's a really clean approach to hierarchies and gives us a way to clearly communicate territory boundaries to our sellers."
Questions to ask to help define your TAM
Finding your TAM gets easier when you know to ask the right questions. Consider the following as you define your total addressable market:
What is the size of the target market?
What are the demographics and firmographics of potential customers?
What are the ideal customer profiles based on data attributes such as industry, number of employees, and location?
Are there any specific attributes such as department, role, and title level for individual records that need to be considered?
How do you prioritize accounts based on demographic, behavioral, and intent scoring values?
When was each record in the count last verified, and by what method?
You can also build and segment prospect lists directly from your TAM definition, using firmographic filters to generate the account universe your campaigns and sequences will run against.
Go to market smarter: activating your TAM with AI
A TAM is a list of accounts with a number attached. Turning it into pipeline means knowing which of those accounts is in-market this week, and that requires a different kind of data than the count did.
ZoomInfo's platform brings together three capabilities that make TAM analysis actionable rather than theoretical. The foundation is data: ZoomInfo's verified B2B data covers 500M contacts, 100M companies, and 135M+ verified phone numbers, maintained by 300+ human researchers at up to 95% accuracy on first-party data. ZoomInfo is a Leader in the Gartner Magic Quadrant for ABM Platforms (2024 and 2025) and a Leader in the Forrester Wave for Intent Data Providers B2B with highest scores across 8 criteria (Q1 2025). That scale and verification depth is what makes the firmographic filtering in a TAM analysis reliable rather than approximate.
The intelligence layer is the GTM Context Graph, which processes 1.5B+ data points daily, fusing your CRM data, intent signals, and behavioral history into a unified reasoning layer. A firmographic filter tells you which accounts belong in your TAM. The GTM Context Graph tells you which of them are researching the problem right now, and what they are reading. That closes the loop between sizing and activation. For demand gen teams, that means moving from a static account list to a live, prioritized view of which segments to activate right now.
The execution environment is where all three access lanes come together. GTM Workspace gives sellers the same intelligence in their daily workflow. GTM Studio lets marketers build audiences in natural language, launch plays against those accounts, and measure pipeline impact without filing an engineering ticket. Developers and AI agent builders connect via APIs and MCP to bring ZoomInfo's verified data into any tool or workflow. Same data, same intelligence, no lock-in.
Ready to turn your TAM into pipeline? Request a demo to see how ZoomInfo's GTM Platform activates your market.
Frequently asked questions about total addressable market
What is total addressable market (TAM) and why does it matter for marketing?
TAM is the total revenue opportunity available for a product or service if it achieved 100% market share, a theoretical ceiling rather than a forecast. For marketing teams, TAM matters because it defines the universe of accounts worth targeting, informs how budget should be allocated across segments, and gives leadership a credible benchmark for measuring pipeline progress against potential. Without a defined TAM, campaign prioritization and audience segmentation decisions lack a principled foundation.
How do you calculate TAM for a B2B SaaS company?
Three methods apply. Top-down starts with an industry analyst figure and applies segment filters to narrow to your ICP. Bottom-up multiplies total ICP-matching accounts by your average contract value (ACV). Value-theory applies when you are creating a new category with no historical spend data: estimate willingness-to-pay and multiply by the potential buyer population. Bottom-up is the most reliable for B2B SaaS because it uses first-party firmographic data rather than third-party estimates. The ZoomInfo TAM Calculator automates the bottom-up calculation using live firmographic data.
What is the difference between TAM, SAM, and SOM?
TAM (Total Addressable Market) is the full market if you captured 100% share. SAM (Serviceable Addressable Market) is the segment of TAM your current GTM motion and geographic reach can serve. SOM (Serviceable Obtainable Market) is the realistic portion of SAM you can capture given competitive density and sales capacity. SOM is what your annual pipeline target should be built against, because it accounts for competitors already in the market and the accounts your team has capacity to pursue.
What is a good total addressable market size?
It depends on business stage. VC-backed startups typically need a TAM of $1B or more to justify venture-scale returns, based on the return math that venture funds require. Bootstrapped or SMB-focused businesses can thrive with a $50M to $200M TAM if competitive density is low and margins are strong. For enterprise GTM teams, the more relevant question is SAM coverage: what percentage of your reachable market is your pipeline actually touching? A precisely calculated smaller TAM is more actionable than a loosely estimated large one.
Does TAM actually matter, or is it just a pitch-deck number?
On its own, close to a pitch-deck number. A TAM total with no account list behind it cannot be assigned to a rep or measured against. The layer underneath is what you can act on: the named accounts, the segment bands and the ACV assumption for each. Build those and the headline total falls out for free. You can also answer the question the board asks next, which is what share of your reachable market your pipeline is touching right now. Build the total first and work backwards and you usually cannot.
How does TAM analysis connect to ABM and demand gen strategy?
TAM analysis is the foundation for ABM targeting. Once you know the full universe of accounts that could buy your product, you can break it into micro-TAMs by industry, headcount, and geography to identify where you win most often. Demand gen teams use these micro-TAMs to prioritize which segments to activate first, how much budget to allocate per segment, and how to measure pipeline penetration against potential. The GTM Context Graph adds an intelligence layer on top of TAM, revealing which accounts within your TAM are actively in-market based on intent signals and behavioral data, so you are activating against live signals rather than a static list.
What tools do marketers use to calculate and segment TAM?
Common approaches include B2B data platforms with firmographic filtering (filter by industry, company size, revenue, and geography to count ICP-matching accounts), spreadsheet models using ACV multiplied by account count for bottom-up calculations, analyst reports from Gartner or Forrester for top-down industry sizing, and dedicated TAM calculators that automate the filtering and counting steps. The ZoomInfo TAM Calculator lets GTM teams run a TAM analysis in minutes using live firmographic data, without building a spreadsheet model from scratch.