
What is lead scoring?
Lead scoring is a systematic approach to evaluating and ranking potential customers based on their likelihood of making a purchase. It works by assigning numerical values (typically 1-100) to prospect attributes and behaviors, creating a composite score that represents both fit (who the lead is) and engagement (what they do). Marketing and sales teams use these scores to prioritize outreach, focusing time on prospects most likely to convert into paying customers.
Understanding what drives a score requires separating two types of signals:
Explicit (fit signals) | Implicit (engagement signals) |
|---|---|
Job title | Pricing page visits |
Company size | Demo requests |
Industry vertical | Content downloads |
Tech stack | Email opens and clicks |
Geographic location | Webinar attendance |
The most effective models combine both. Fit tells you whether a lead is the right type of buyer. Engagement tells you whether they're ready to buy now. Neither dimension alone gives you a complete picture.
A lead scoring system reduces subjectivity and provides clarity on which leads deserve immediate attention versus those requiring nurturing. Implementation ranges from manual spreadsheet-based tracking to automated systems built into CRM and marketing automation platforms.
Lead scoring also bridges sales and marketing by creating shared language for what "qualified" means. When both teams agree on how leads are ranked, handoffs get cleaner and conversion rates improve. Effective scoring works best as part of a broader lead management process that tracks and nurtures leads from first touch to closed deal.
Why lead scoring matters for B2B revenue teams
According to Salesforce's State of Sales Report, sales reps spend approximately 25% of their average week on prospecting-related activities: 9% researching prospects, 8% prospecting, and 8% prioritizing leads. That's a significant slice of selling time spent on work that a well-calibrated scoring model can systematize.
B2B lead scoring delivers measurable outcomes across revenue operations:
Prioritization: Focus rep time on leads most likely to close, not just those who filled out a form.
Sales efficiency: Reduce time wasted on unqualified prospects and accelerate the sales cycle.
Marketing ROI: Allocate resources to campaigns that generate high-quality leads, not just volume.
Sales and marketing alignment: Create a shared definition of "qualified" that both teams can execute against.
Pipeline velocity: Move the right leads through the funnel faster by identifying buying intent early.
The impact is measurable. Smartsheet saw an 84% MQL increase and a 26% jump in opportunity rates after connecting their scoring model to verified ZoomInfo data.
Signs your team needs lead scoring
You know it's time to implement lead scoring when you see these patterns:
Quality complaints: Sales complains that marketing-qualified leads aren't actually ready to buy
Attribution blindness: Marketing can't tell which campaigns drive pipeline, only which drive form fills
Wasted effort: Reps waste time researching and calling bad-fit prospects
No shared language: No agreed definition of "qualified" exists between sales and marketing
Follow-up gaps: Leads go cold before anyone follows up because there's no prioritization system
Lead scoring models
Most B2B teams still default to BANT (Budget, Authority, Need, Timeline) as their qualification framework. The problem: BANT is a sales conversation checklist, not a scoring model. It requires a rep to ask questions that a well-calibrated scoring model answers automatically from behavioral and firmographic data. Lead scoring replaces the guesswork of BANT with a systematic, data-driven signal.
Not all lead scoring models work the same way. The right approach depends on your sales motion, data availability, and buyer complexity. Most teams use one of three model types:
Model Type | What It Measures | Best For | Example Criteria |
|---|---|---|---|
Demographic / Firmographic | Who the lead is (fit) | Clear ICP, simple buying process | Job title, company size, industry |
Behavioral | What the lead does (engagement) | High-volume inbound, digital-first buyers | Website visits, content downloads, email clicks |
Hybrid (Fit + Engagement) | Both who they are and what they do | Complex B2B sales, multiple stakeholders | Combination of fit and behavioral signals |
Demographic and firmographic scoring
Fit-based scoring evaluates who the lead is. This model answers: does this person match our ideal customer profile?
Common demographic criteria include:
Job title: Decision-makers and influencers score higher than individual contributors
Seniority: VP and C-level roles typically indicate budget authority
Department: Are they in the function your product serves?
Common firmographic criteria include:
Company size: Employee count and revenue indicate whether they fit your target segment
Industry vertical: Some industries convert better than others
Geographic location: Matches your sales coverage and regulatory requirements
Tech stack: Technographics reveal whether they use complementary or competing tools
Accurate data is critical here. Form fills are often incomplete or outdated. If your scoring model relies on bad firmographics, you'll prioritize the wrong accounts. Teams that connect their scoring models to a continuously refreshed B2B data layer, like ZoomInfo's GTM Context Graph, can pull verified firmographic signals directly into their scoring logic instead of relying on stale form data.
Behavioral scoring
Engagement-based scoring evaluates what the lead does. This model answers: is this person showing buying intent?
Behavioral signals ranked roughly by intent level:
Low intent: Blog visits, social media follows
Medium intent: Email opens, content downloads, webinar attendance
High intent: Pricing page visits, product page views, demo requests, form submissions
Combining fit and engagement for accurate scores
The most effective models use both dimensions. A lead can be high-fit but low-engagement (needs nurturing) or high-engagement but low-fit (not worth pursuing). The combination creates a prioritization matrix:
High fit, high engagement: Sales-ready. Follow up immediately.
High fit, low engagement: Right profile, wrong time. Nurture until they show intent.
Low fit, high engagement: Active but not a buyer. Disqualify or route to a different motion.
Low fit, low engagement: Ignore. Don't waste time.
Some teams use separate scores (fit score + engagement score) while others combine into a single composite. Either works. What matters is that you're evaluating both dimensions.
The next section breaks down exactly how grading and scoring differ, and why using both prevents the most common prioritization failures.
Lead scoring vs. lead grading: understanding the difference
Lead grading assigns letter grades (A, B, C, D) to prospects based on firmographic fit signals: who the lead is. It answers the question "Is this the right type of company and person?" A grade reflects factors like company size, industry, and job title. An A-grade lead matches your ICP closely; a D-grade lead is a poor fit regardless of their activity level.
Lead scoring assigns numerical points (typically 0-100) based on behavioral engagement signals: what the lead does. It answers the question "Is this person showing buying intent right now?" A score reflects actions like page visits, content downloads, and demo requests. A high score means the lead is actively researching; a low score means they haven't engaged meaningfully yet.
Lead Grading | Lead Scoring | |
|---|---|---|
Definition | Letter grades based on firmographic fit | Numerical points based on behavioral engagement |
Data inputs | Company size, industry, job title, geography | Page visits, content downloads, demo requests, email clicks |
Output format | A, B, C, D | 0-100 |
Primary question answered | Is this the right type of buyer? | Is this buyer showing intent right now? |
Example | A = VP Sales at 500-person SaaS company | 85 = visited pricing page twice, downloaded whitepaper |
Combining both frameworks prevents two common failure modes. An A-grade lead with a score below 30 needs nurturing: they're the right profile but haven't engaged yet. A D-grade lead with a score of 80 is active but not a buyer, disqualify or route to a different motion. The combination prevents both false positives (high-scoring bad-fit leads) and false negatives (high-fit leads who haven't engaged yet).
B2B lead scoring criteria examples
Lead scoring models typically combine implicit data (inferred from a customer's online behavior, such as website activity, email engagement, or content downloads) and explicit data (information customers directly provide, such as name, company, job title, or location) to create a comprehensive picture of a prospect.
The specific attributes you score determine whether your model actually predicts conversions or just ranks activity. The right criteria depend on your business, but most B2B scoring models organize around three categories: fit attributes, engagement attributes, and intent signals.
Fit attributes for lead scoring
Fit attributes tell you whether the lead matches your ideal customer profile. These are the firmographic and demographic criteria that indicate ICP match or disqualification:
Company size (employee count, revenue): Does this company have the scale and budget to buy?
Industry vertical: Do they operate in a sector where your product delivers value?
Geographic location: Can your team sell and support them in their region?
Job title and seniority: Is this person a decision-maker, influencer, or end user?
Department: Are they in the function your product serves?
Tech stack (technographics): Do they use tools that complement or compete with yours?
Accurate firmographic data is the foundation. The GTM Context Graph processes 1.5B+ data points daily across 500M contacts and 100M companies, giving scoring models a continuously refreshed signal rather than stale form data. Data accuracy matters here. If your scoring model relies on outdated or incomplete firmographics, you'll prioritize the wrong accounts. Garbage in, garbage out.
Engagement attributes for lead scoring
Engagement attributes tell you whether the lead is showing buying intent. These are the behavioral signals that indicate active research and interest:
Website activity: Pages viewed, time on site, return visits (especially pricing and product pages)
Email engagement: Opens, clicks, replies
Content engagement: Downloads, webinar attendance, video views
Form submissions: Contact requests, demo requests, trial signups
Social engagement: Shares, comments, follows
Weight high-intent actions appropriately. A demo request is worth more than a blog visit. A pricing page view signals readiness. A single email open does not.
Intent signals and buying indicators
Intent signals and trigger events go beyond owned behavioral data. These are third-party signals that identify leads showing buying behavior before they ever fill out a form:
Intent signals: Research activity on relevant topics across the web (e.g., consuming content about "sales intelligence" or "lead scoring software")
Trigger events: Funding rounds, leadership changes, new hires, office expansions, technology purchases
Intent signals also work at the account level. When multiple stakeholders at the same company research the same topics, the aggregate signal is far stronger than any individual contact's behavior.
These signals can identify leads in-market before they visit your website. A company hiring five new SDRs is likely evaluating sales tools. A company that just raised a Series B has budget to spend. Position these as advanced criteria for teams ready to move beyond basic scoring.
How to build a lead scoring system
Now that you understand what lead scoring is and why it's important, it's time to learn how to build a system for your business. No matter which method you use, there are five key steps to building a successful lead scoring system:
Step 1: Define your ideal customer profile
Before you can score your leads, you must have a clear understanding of the characteristics that make a prospect an ideal fit for your products and services. A buyer persona is a semi-fictional representation of your ideal customer, built from quantitative research, observed patterns, and existing customer data. Defining your buyer personas is also crucial for setting your Ideal Customer Profile (ICP), ensuring you target the most valuable accounts.
Your scoring model is only as good as your ICP clarity. If you don't know who you're trying to reach, you can't score for fit.
Step 2: Identify key scoring attributes
The selection process should focus on which attributes actually correlate with closed deals in your business. Review won and lost deals to identify patterns, then ask:
Which job titles convert at the highest rate?
Which company sizes have the best win rates?
Which behavioral signals predict pipeline progression?
Which engagement patterns indicate buying intent?
Let your conversion data guide your criteria selection, not assumptions.
Step 3: Assign point values
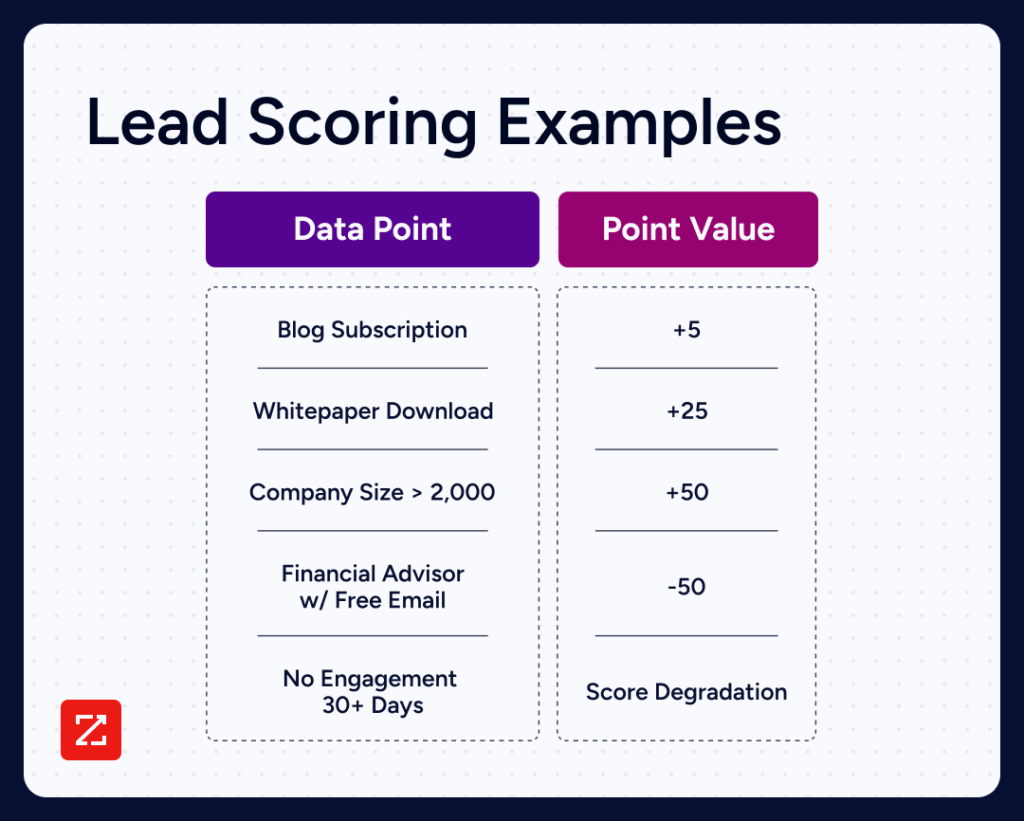
Not all scoring criteria are created equal. Remember: your goal is to define which traits and actions eventually lead to a closed deal. So, you need to assign numerical values to each data point accordingly.
For example, leads who subscribe to receive blog updates don't often convert to paying customers. Conversely, leads who download a whitepaper tend to have a very high conversion rate. So, blog subscribers get scored two points while those who download white papers get 25 points.
Use a consistent scale (e.g., 1-100) and weight high-intent actions appropriately. Point values should reflect actual conversion correlation, not assumptions. Here's a simple example:
Action | Point Value | Rationale |
|---|---|---|
Blog subscription | +5 | Low intent, passive interest |
Whitepaper download | +25 | Medium intent, active research |
Pricing page visit | +40 | High intent, evaluating cost |
Demo request | +50 | Very high intent, ready to engage |
Enterprise company (1000+ employees) | +30 | Fits ICP, budget authority |
For example, a VP of Sales at a 500-person SaaS company who visited the pricing page twice and downloaded a whitepaper would score 95 points (30 for enterprise fit + 40 for pricing page + 25 for whitepaper download), well above a typical 70-point MQL threshold.
Step 4: Set MQL and SQL thresholds
Once you assign point values, determine what score range represents "sales-readiness." This threshold requires testing and analysis when you first implement lead scoring. It's where sales and marketing alignment happens.
For example, if analysis shows leads scoring below 30 rarely convert, establish a clear agreement: Sales follows up with leads scoring 30 or higher. Leads below that threshold enter a nurture program until they show stronger buying signals.
Thresholds should be tested and adjusted based on conversion data. Your initial ranges are a hypothesis. Let results refine them.
Step 5: Operationalize in your CRM
Manual lead scoring becomes unmanageable at scale. With thousands of leads and constantly changing scores as prospects move through the sales funnel, manual tracking creates productivity problems, data inaccuracies, and lead-routing issues.
GTM Studio solves this directly. RevOps and marketing teams can launch scoring plays, build automated routing workflows, and push enriched segments into CRM without filing an engineering ticket. Specifically, GTM Studio handles:
Automatically creating and feeding your CRM, campaigns, and routing workflows important data segment information
Creating multiple, highly customized scoring models
Identifying the most high-priority leads via AI-powered Account Fit Score (a 0-100 predictive score based on firmographic patterns that predict conversion)
Marketing automation handles the broader repetitive work. Most platforms apply automation to sales workflows like triggering campaigns, personalizing ads, and prioritizing leads. Most marketing automation tools also have lead scoring software built in: enter your scoring criteria, and the platform scores leads as they come in and updates scores as they change.
Negative scoring and score decay
Scoring isn't just additive. You should also subtract points for signals that indicate disqualification or disengagement.
Negative scoring criteria include:
Unsubscribes: Lead has opted out of communication
Bounced emails: Invalid contact information
Competitor matches: They work for a competitor, not a prospect
Non-buyer roles: Students, job seekers, or roles with no purchasing authority
ICP mismatches: Company size, industry, or location outside your ideal customer profile
Score decay is equally important. Scores should decrease over time if engagement stops. A lead who downloaded a whitepaper 18 months ago is less sales-ready than one who did so last week. Implement time-based decay to prevent inflated scores from stale activity.
Predictive lead scoring and AI
Predictive lead scoring systems use machine learning to build algorithms that automatically analyze data from customers and prospects. These systems forecast conversion likelihood and assign corresponding scores.
Predictive scoring differs from rules-based scoring in how it determines point values. Instead of manually assigning points, machine learning analyzes patterns in historical conversion data (which attributes and behaviors correlated with closed deals) and applies those patterns to score new leads.
Realistic expectations matter. Predictive scoring requires clean historical data, sufficient deal volume, and ongoing model training. The model is only as good as the data feeding it.
Here's how rules-based and predictive scoring compare:
Rules-Based Scoring: Manual point assignment based on expert judgment. Works well for clear ICPs and simple buying processes. Requires ongoing manual refinement.
Predictive Scoring: Algorithm-driven point assignment based on historical conversion patterns. Works well for high lead volume and complex buyer journeys. Requires clean data and sufficient volume to train the model.
How predictive lead scoring works
Predictive models analyze patterns in historical conversion data: which attributes and behaviors correlated with closed deals. Then they apply those patterns to score new leads.
What's needed for predictive scoring to work:
Clean historical data: Accurate records of won and lost deals with complete firmographic and behavioral data
Sufficient deal volume: Hundreds or thousands of closed deals to identify statistically significant patterns
Ongoing model training: Regular updates as buyer behavior and market conditions change
The model is only as good as the data feeding it. If your historical data is incomplete or inaccurate, the algorithm will learn the wrong patterns. Teams that connect their scoring models to a continuously refreshed B2B data layer, like the GTM Context Graph, give the algorithm verified firmographic, technographic, and intent signals rather than stale or incomplete records.
When to use AI lead scoring
Predictive scoring makes sense when you have high lead volume, clean historical data, and complex buyer journeys. Rules-based scoring is fine when you have lower volume, a clear ICP, and a simple buying process.
Many teams start with rules-based and graduate to predictive as they scale. There's no shame in starting simple.
AI can also assist across the GTM workflow beyond just scoring. ZoomInfo is an all-in-one AI GTM Platform, and tools like GTM Workspace surface insights, automate workflows, and guide seller actions in real time, helping teams prioritize accounts and engage buyers more effectively.
For teams ready to implement AI lead scoring, the GTM Context Graph's intent signals and firmographic data feed directly into predictive models. No manual data pipeline required.
Lead scoring best practices
Now that you've built your scoring system, here's how to make it work. Execution matters more than the model itself. Follow these best practices to ensure your scoring drives results:
Align sales and marketing on lead definitions
Scoring only works if both teams agree on what the scores mean. Without this alignment, marketing optimizes for volume while sales complains about quality.
The act of jointly defining scoring criteria creates a shared language that reduces finger-pointing over lead quality. When sales and marketing agree on what a 70-point lead means, the conversation shifts from who is sending bad leads to how to improve the model together.
Alignment checklist:
Shared MQL and SQL definitions: Document what score range qualifies a lead as marketing-qualified vs. sales-qualified
Documented handoff process: Define when and how leads transition from marketing to sales
Regular feedback loops: Sales tells marketing which scored leads converted and which didn't
Joint ownership: Both teams are accountable to the same conversion metrics
Account-level scoring and buying groups
B2B buying often involves multiple stakeholders, so scoring individuals isn't enough. Account-level scoring aggregates engagement across contacts at the same company.
Account-level signals to track:
Multiple stakeholders engaging: Three contacts from the same company downloading content signals buying committee activity
Seniority and role weighting: A VP engaging matters more than an individual contributor
Cross-functional engagement: When both IT and business leaders show interest, deals move faster
Account score aggregation: Sum or average individual scores to create an account-level priority
Account-level scoring works. Snowflake saw 90% higher opportunity open rates on accounts scored using ZoomInfo's verified data.
This approach matches how enterprise B2B buying actually happens. One champion isn't enough. You need multi-threading across the buying group.
Audit and iterate your scoring model
Scoring models degrade over time as markets, products, and buyer behavior change. Scoring is not set-and-forget.
Audit questions to ask quarterly or semi-annually:
Are MQLs actually converting? Check threshold accuracy and adjust if needed
Which criteria correlate with wins? Adjust point values based on conversion data
Has our ICP evolved? Refresh criteria as your target customer changes
Are we seeing false positives? Identify and add negative scoring criteria
Is score decay working? Ensure old activity doesn't inflate current scores
Want to see how better data improves your lead scoring? Talk to our team to learn how ZoomInfo can help. Teams can access ZoomInfo's intelligence through GTM Workspace for sellers, GTM Studio for marketers and RevOps, or directly via APIs and MCP for custom agents and tools, all drawing from the same GTM Context Graph.
Frequently asked questions
What is lead scoring in B2B marketing?
Lead scoring is a systematic process for ranking prospects by assigning numerical values (typically 0-100) to their attributes and behaviors. B2B teams use two types of signals: explicit signals (firmographic fit, including job title, company size, and industry) and implicit signals (behavioral engagement, including page visits, content downloads, and demo requests). The combined score tells sales which leads to prioritize and tells marketing which campaigns are generating quality pipeline, not just volume.
What is the difference between lead scoring and lead grading?
Lead scoring assigns numerical points (0-100) based on behavioral engagement: what a lead does, such as page visits, demo requests, and email clicks. Lead grading assigns letter grades (A-D) based on firmographic fit: who a lead is, including company size, job title, and industry. The most effective B2B teams use both: grade for fit, score for intent. A high-scoring D-grade lead is active but not a buyer. A high-grade low-scoring lead is the right profile but not ready yet.
How do you set MQL thresholds for lead scoring?
Start by analyzing historical conversion data: which score ranges correlate with closed deals? Set your initial MQL threshold at the score where conversion rates meaningfully improve. A common starting point is 50-70 points on a 0-100 scale, but this varies by business. Test the threshold for 60-90 days, then adjust based on whether sales-accepted leads are converting. The threshold is a hypothesis, not a permanent rule. Revisit it quarterly as your ICP and buyer behavior evolve. Smartsheet's 84% MQL increase came from doing exactly this: connecting scoring to verified data and calibrating the model based on what actually converted.
What's the difference between rules-based and predictive lead scoring?
Rules-based scoring assigns point values manually based on expert judgment: you decide that a pricing page visit is worth 40 points and a blog visit is worth 5. It works well for clear ICPs and lower lead volumes. Predictive lead scoring uses machine learning to analyze patterns in historical conversion data and automatically weight attributes based on what actually correlates with closed deals. It works better at high lead volumes with clean historical data. Many teams start with rules-based and graduate to predictive as they scale.
How often should you audit your lead scoring model?
Audit your lead scoring model quarterly or semi-annually at minimum. Check whether MQLs are actually converting at the expected rate, whether your ICP has evolved, and whether score decay is preventing stale activity from inflating current scores. Markets change, buyer behavior shifts, and product positioning evolves. A model calibrated 18 months ago may be rewarding the wrong signals. The most common failure mode is treating lead scoring as a one-time setup rather than an ongoing process.
What data do you need for predictive lead scoring to work?
Predictive lead scoring requires three things: clean historical data (accurate records of won and lost deals with complete firmographic and behavioral data), sufficient deal volume (typically hundreds or thousands of closed deals to identify statistically significant patterns), and continuously refreshed signals (the model is only as good as the data feeding it). Teams that connect their predictive models to a live B2B data layer, like the GTM Context Graph, which processes 1.5B+ data points daily, give the algorithm verified firmographic, technographic, and intent signals rather than stale form fills.