
What ZoomInfo org charts show, and why it matters for B2B sales
An organizational chart is a roster for sales. It shows the position everyone plays in an organization, making it a sales prospecting blueprint to identify the decision-makers at target accounts.
Yes, ZoomInfo includes org chart functionality as part of its platform. The ZoomInfo org charts feature displays a company's reporting structure, stakeholder relationships, job titles, responsibilities, and direct contact information for each node in the hierarchy. Sellers access it through GTM Workspace, ZoomInfo's all-in-one AI GTM Platform for quota-carrying reps.
Org charts are part of ZoomInfo's Elite plan. Here is what that unlocks for multi-threaded selling: you can see who reports to whom, identify the full buying committee before your first call, and engage multiple stakeholders simultaneously rather than discovering new ones in the final stages of a deal.
That org chart data is backed by ZoomInfo's broader data platform: 500M contacts, 100M companies, 135M+ verified phone numbers, 120M+ direct-dial phone numbers, and 200M+ verified business emails. Those numbers mean every name and title in the org chart is tied to a reachable, verified contact, not just a label on a diagram.
How to use ZoomInfo org charts for multi-threaded outreach
One of the most common late-stage deal surprises for AEs is discovering stakeholders they never knew existed. You get to legal and suddenly there is a CFO and a procurement lead who have been involved the whole time. The ZoomInfo org charts feature gives you the full picture before that happens. Here is a four-step workflow for using it.
Step 1: Pull the org chart for your target account
Open the target account in ZoomInfo and navigate to the org chart view. You will see the full reporting structure: who sits at each level, how teams are organized, and which contacts have verified phone numbers and emails attached. This is your map before you make a single call.
Step 2: Map stakeholders by archetype
Understanding the structure of teams helps you identify key decision-makers and champions for a multi-threaded outreach approach. Assign each stakeholder a role archetype:
Economic Buyer: C-suite or VP who controls budget (e.g., CRO, CFO, VP of Sales)
Champion: Director or Manager who will use the product day-to-day and will advocate for it internally
Technical Evaluator: IT, Security, or Ops who assesses integration and compliance
Influencer: Peers and ICs whose adoption shapes the internal conversation
Step 3: Sequence outreach by tier
Start with the Champion to build groundswell. When individual contributors are talking about a problem and your solution, that conversation travels up the org chart. Then loop in the Economic Buyer via a top-down referral: if you can get the Champion to introduce you upward, or if you reach out to the Economic Buyer directly and reference the Champion's interest, the response rate climbs significantly. Building multi-threaded relationships from the start protects the deal when any single contact goes cold or changes roles.
Step 4: Track multi-threaded engagement in GTM Workspace
Use GTM Workspace to track engagement across all stakeholders in one place. Every thread, Champion, Economic Buyer, Technical Evaluator, stays visible so no conversation goes cold and no stakeholder falls off your radar. This is where the org chart data moves from a lookup into an active selling workflow.
Use org charts to determine sphere of influence
When reaching out to an organization, the buyers who will influence the sale decision are often unknown at the start. Titles alone do not tell you much, so determining the sphere of influence is where org charts earn their place first.
Your team might have a name to reach out to, but that person might not end up signing off on the deal. When it comes to an inbound lead, you need to understand who is in that sphere of influence and who they influence. Org charts show who else is in their direct reporting structure:
Who do they report to?
Who else is on their team?
What other teams might work with them, based on their job function?
Understanding the sphere of influence lets you bring different players into the conversation earlier in the sales cycle, so you gain more traction. Ultimately, this will shorten the sales cycle as a whole.
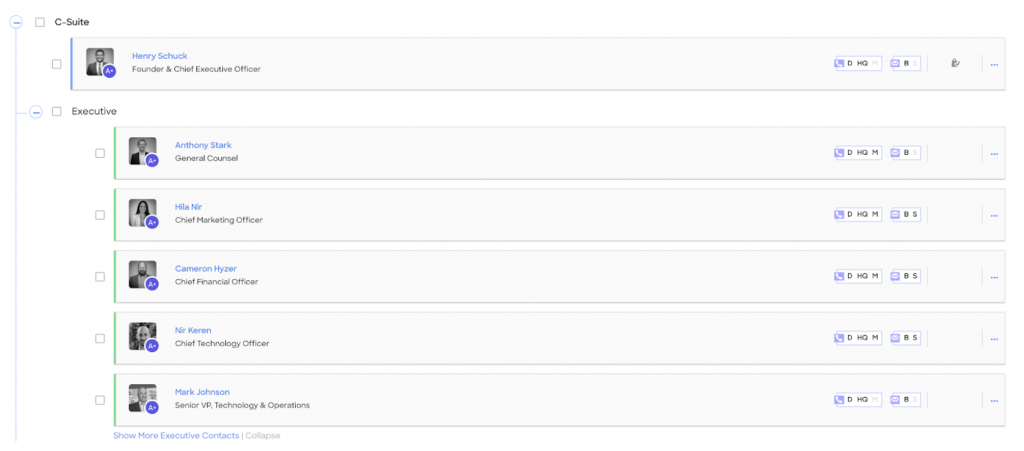
"The roadmap to your buyer is incredibly valuable," says Steve Waters, ZoomInfo's Senior Director of Commercial Sales. "You know exactly which person or people you need to engage. Most of the people sales reps talk to can't actually sign the check."
Mapping the sphere of influence also protects against the buying committee blind spots that cause late-stage deal surprises. When you know who else is involved before your second call, you stop discovering new stakeholders after the contract is already in review.
Find multiple points of entry for outbound prospecting
Have you ever been in the middle of a productive, promising email conversation with a prospect and they left you on read?
That is the danger of a single-threaded relationship. If your point-person has a change of heart or stops responding, your relationship is dead in the water. And so is the deal.
Org charts make it easy to have multi-threaded relationships so there is involvement with more than one person at your target account from the start. If you identify multiple stakeholders and include them all in the conversation early, it is a lot easier to keep it going even when someone gets busy or loses interest.
Building support from individual contributors
Another benefit of using organizational hierarchy data is finding multiple stakeholders and potential users, and building a groundswell for your solution among employees.
If somebody is CC'd on an email from their boss saying, "Hey, you should talk to ZoomInfo," they are far more likely to open that email, respond, and engage with you as you reach out to them.
Use the sales org chart to look at the sphere of influence for individuals with an eye toward referrals that move through the organizational chart. Starting at the top and working on getting top-down referrals is another area of focus.
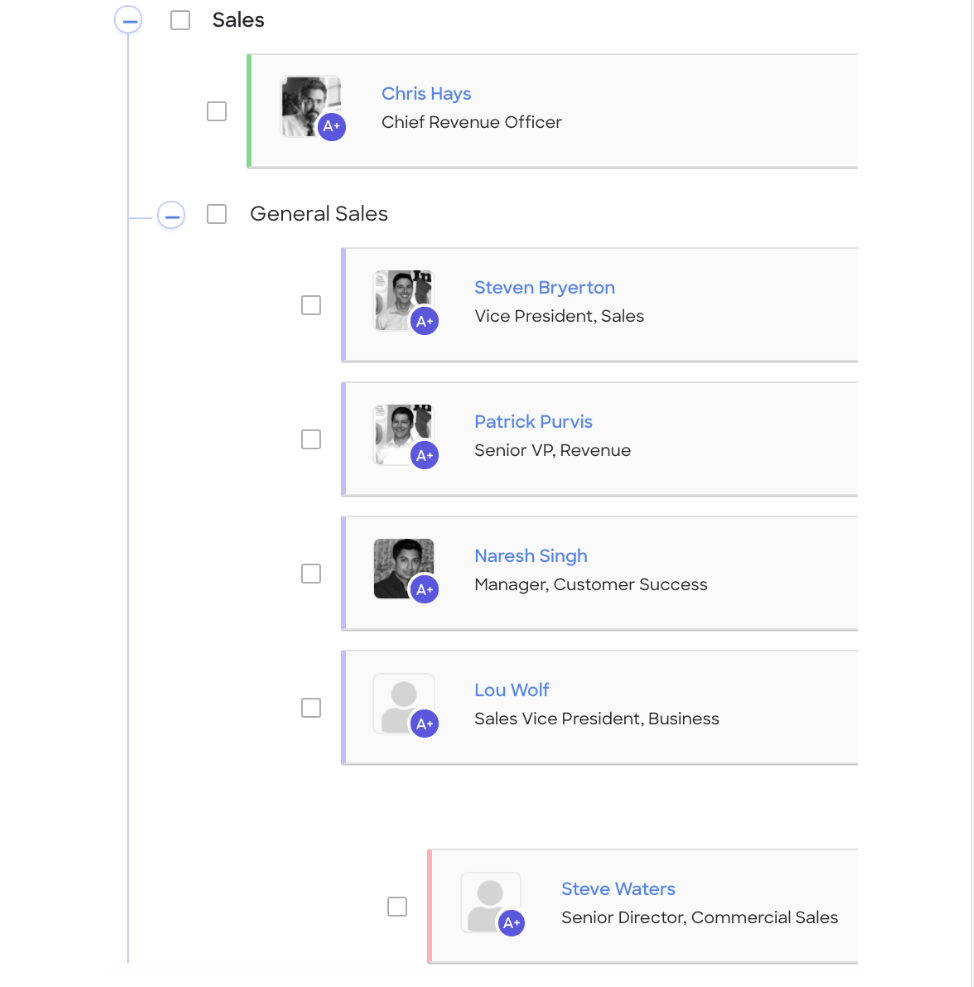
"If a lot of people are talking about the problem and your solution at the water cooler," says Waters, Senior Director of Commercial Sales, "that gets back up the food chain, especially in larger organizations." The decision-makers will hear about it.
If you can build groundswell with the actual users, that will get back to the decision-maker even though they do not have purchasing power. GTM Workspace surfaces all stakeholder engagement in one place, so reps do not lose track of multi-threaded conversations across tools.
Expand within existing accounts using org chart data
The fastest path to higher total contract value and better retention is already inside your existing accounts, if you know where to look in the org chart.
From cross-selling to up-selling
If you understand what is going on in the org chart, you can find multiple buyers or groups that can leverage your tool, giving you a higher price point or getting you that up-sell.
Marketing and HR departments, for example, have very different pain points and likely buy different solutions. Use the org charts to identify buyers in other departments, and ask your existing users for a referral or introduction.
Within departments
If you have a SaaS model and you want to sell more seats or user licenses, use the org chart to land and expand.
Large organizations have several sales and marketing teams, even multiple brands. And the left hand does not always know what the right hand is doing.
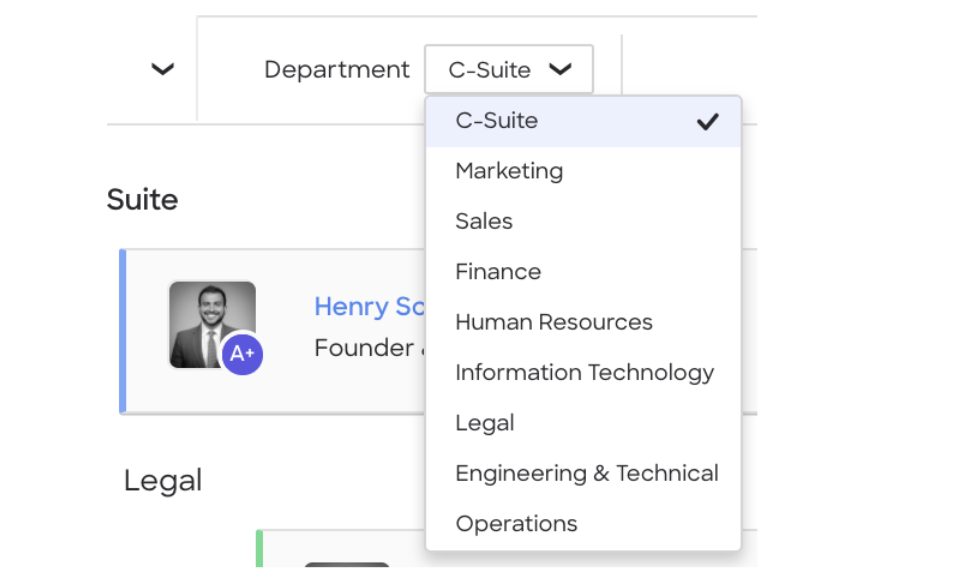
"Maybe you sell to inside sales," Waters says, "but you want to sell to field sales. At larger companies, there are different sales teams. Take the example of Microsoft: There's the Azure team, the Microsoft Dynamics team."
"Then if you look at the org chart, you'll see departments that are specific to divisions like Consumer and Devices, geographic regions, cloud, Blockchain, enterprise solutions, small business solutions."
Without it, you would not know these opportunities existed.
ZoomInfo org charts vs. finding org chart data manually
Sellers can piece together org chart data from LinkedIn, company websites, SEC filings, and tools like The Org. Each of those sources has real value in the right context. The question is whether the time and accuracy tradeoffs work for a quota-carrying rep.
Source | Accuracy | Reporting lines | CRM integration | Time to insight |
|---|---|---|---|---|
ZoomInfo | High, continuously verified | Yes | Native sync | Minutes |
High but self-reported | No | Manual | Hours | |
Company website | Variable, often outdated | Sometimes | None | Hours |
SEC filings | Low for contacts | Sometimes | None | Hours |
The Org | Variable | Yes | None | Minutes, limited depth |
ZoomInfo's org chart data is part of the GTM Context Graph, the intelligence layer that fuses org chart data with CRM records and buying signals to surface not just who is in the org, but which stakeholders are actively in-market. The differentiator is not just having the data, it is reasoning across it. Sellers access this unified view inside GTM Workspace, where org chart context sits alongside intent signals and engagement history in a single workflow.
See ZoomInfo org charts in action, request a demo.
CC all stakeholders in your emails
In most enterprise deals, C-level leaders refer evaluation work down the org chart, which means the person who answers your cold call is rarely the person who signs the contract.
"People are much more likely to respond if their boss or colleague is CC'd on the email," says Waters, Senior Director of Commercial Sales. "I like to use the org chart to see who my prospect reports to, and CC them on cold or follow-up emails."
When you copy your prospect's boss, it lights a fire under them to take action.
The purpose of using the org chart is to get rid of the one-to-one email exchange.
Does that mean someone is going to email you right back? Not necessarily. But it does increase the likelihood that the team has an internal conversation about your product. If you deliver high value in your messaging to these individuals, they are far more likely to engage and get that demo scheduled.
Follow up with the real decision-maker after events
Events are a great way to get everyone involved excited. Afterward, not so much.
When they get back to the everyday work of their jobs, they often go cold, and those potential deals die on the vine.
Does this sound familiar?
If you can then target others within the organization and leverage that interaction, conveying some of the passion that they felt while they were at the event, your message is going to connect in a way that is much more unique.
That is where org charts come in.
Use the org chart to identify the decision-makers who matter, then reach out with the context from the event to stand out from the crowd.
You are no longer that person saying, "Hey, I want to sell you my product." Instead, you are saying, "What a great experience I had with your team. Here are so many different ways I think we can move forward together."
That messaging sounds so much different to somebody who is considering your service or ready to buy.
How ZoomInfo org chart data stays accurate
ZoomInfo's data accuracy starts with how the data is built. More than 300 human researchers work alongside automated systems to verify contact and company information across multiple sources. The platform processes 1.5B+ data points daily, which means the org chart data you pull on a Tuesday reflects changes that happened last week, not last quarter.
The scale behind that verification matters for org chart accuracy specifically. ZoomInfo covers 500M contacts and 100M companies, with 200M+ verified business emails and 120M+ direct-dial phone numbers. Every name and title in an org chart view is tied to contact information that has been checked against multiple sources, not just scraped from a single directory. That coverage means the org chart is not just a hierarchy diagram, it is a hierarchy of reachable people.
The practical pain this addresses is real: contacts change jobs constantly, and most CRMs have no mechanism to catch it. Reps hit voicemails for people who left companies two years ago. Emails bounce to addresses that have been inactive since the last reorg. ZoomInfo's continuous enrichment process flags role changes and departures as they happen, so the org chart data in your workflow reflects the current state of the account, not the state it was in when you first imported it.
Org charts give you the full picture of every target account
All of these different areas push you to think beyond one-to-one exchanges with individuals. Think of your target accounts as a collective whole, a decision-making group.
"When I think of the org chart," says Waters, "I think of having a treasure map in my back pocket, not just who is in the organization, but who matters most right now and why."
That clarity translates directly to pipeline. Seismic's sales team attributed 39% of active pipeline to ZoomInfo signals, including org chart and buying committee data, while saving 11.5 hours per week per seller. That is what happens when you stop working accounts one contact at a time and start working the full buying committee from the first touch.
Frequently asked questions about ZoomInfo org charts
Does ZoomInfo show org charts?
Yes, ZoomInfo includes org chart functionality that displays a company's reporting structure, stakeholder relationships, and contact information. The ZoomInfo org charts feature shows who reports to whom, direct report counts, job titles, and available contact data for each node in the hierarchy. Sellers access it through GTM Workspace as part of ZoomInfo's all-in-one AI GTM Platform.
Which ZoomInfo plan includes org charts?
ZoomInfo org charts are included in the Elite plan. If you are evaluating ZoomInfo and org chart access is a priority, confirm with your ZoomInfo rep that org chart functionality is included in your specific contract, as feature availability can vary by negotiation and add-on configuration. ZoomInfo's pricing is free to start with consumption credits based on usage. Talk to a ZoomInfo rep to confirm what is included in your evaluation.
How do ZoomInfo org charts help shorten the sales cycle?
ZoomInfo org charts help shorten the sales cycle by revealing the full buying committee early, so sellers can engage all decision-makers simultaneously rather than discovering new stakeholders late in the deal. Multi-threaded relationships reduce the risk of a single point of contact going cold or leaving the company. Seismic's sales team, for example, saved 11.5 hours per week per seller while attributing 39% of active pipeline to ZoomInfo signals, including org chart and buying committee data.
Where can I find company org charts for B2B prospecting?
B2B sales teams can find company org charts through ZoomInfo (most accurate for sales prospecting, with CRM integration and verified contact data), LinkedIn (high accuracy but no reporting-line data and manual effort required), company websites (variable accuracy, often outdated), and tools like The Org (visual hierarchy but limited contact depth). For sales prospecting specifically, ZoomInfo is the only option that combines org chart data with verified contact information and CRM sync in one platform.
How accurate is ZoomInfo org chart data?
ZoomInfo's org chart data is backed by a continuous verification process: 300+ human researchers, multi-source data collection, and 1.5B+ data points processed daily across 500M contacts and 100M companies. The platform continuously enriches contact records, which means org chart data reflects role changes and departures faster than static databases or self-reported sources like LinkedIn. For sellers, this means fewer wasted calls to contacts who have left the company and more accurate reporting lines for multi-threaded outreach.