
Customers rarely decide to leave on the day the renewal notice lands. The warning signs show up months earlier, in falling usage, a quiet champion, or a new executive who never bought into your product. Reactive retention starts when the notice arrives. Churn prediction starts while there is still time to act.
This guide shows you how to build a churn prediction model that catches those signs early and how to turn its scores into a renewal forecast you can defend. It also covers which signals to feed the model, how to test it, and what your team should do once an account is flagged.
What Is Churn Prediction?
Churn prediction is the process of using customer data, and usually machine learning, to estimate which customers are likely to cancel or not renew within a set period. It is a form of predictive analytics, sometimes called churn propensity scoring. Each account gets a risk score, so customer success and account teams can focus on the renewals most likely to be lost before the churn event happens.
Customer churn prediction sits alongside two related practices, and each answers a different question:
| Churn rate | Churn analysis | Churn prediction |
Question it answers | How many customers did we lose? | Why did they leave? | Who is likely to leave next? |
Looks | Backward | Backward | Forward |
Output | A percentage | Churn patterns by segment | A risk score per account |
Used for | Reporting and benchmarks | Fixing systemic problems | Saving renewals and forecasting revenue |
If you need the formulas, start with our guide on how to calculate churn rate. For root-cause work, see our guide to customer churn data. This guide covers the forward-looking part.
Why Churn Prediction Matters for Renewal Forecasting
Churn rate tells you what you already lost. Churn prediction tells you what you are about to lose, while you can still change it. That shift turns customer retention from a quarterly report into something you can plan, forecast, and manage.
ZoomInfo runs its own customer base this way. Account management and customer success leadership hold a monthly churn forecast meeting, run much like a pipeline review. When forecast churn in any segment runs above plan, the team diagnoses why and responds with retention campaigns, pricing promotions, or advanced training, according to ZoomInfo's Data-Driven Account Manager report.
A working churn prediction model pays off in three ways:
A forecast you can defend. Renewal revenue becomes a probability-weighted number, which improves forecast accuracy across the whole revenue plan and shows your real revenue exposure.
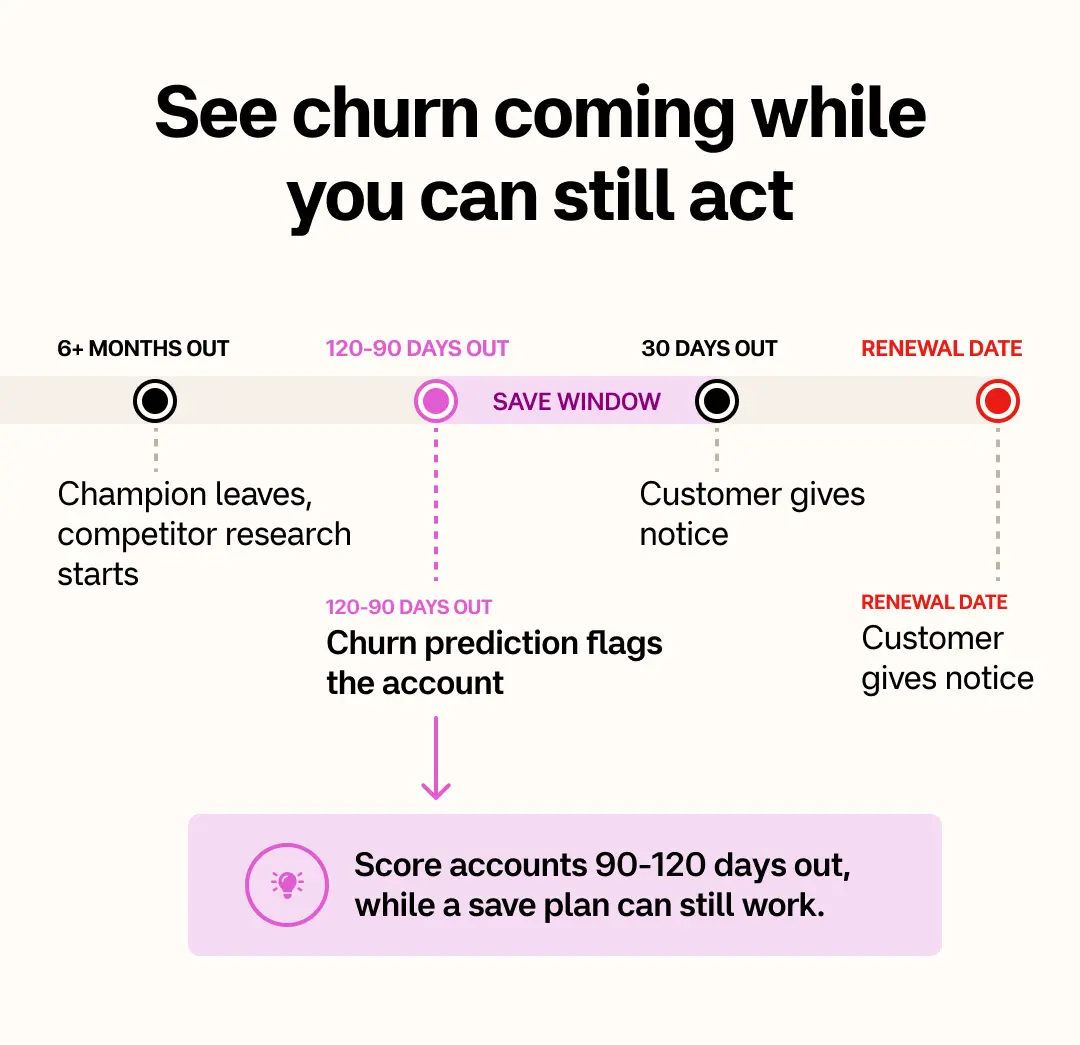
Earlier saves. Teams reach high-risk customers months ahead of the renewal, when a save plan can still work and before the loss turns into revenue leakage.
Focused effort. Customer success time goes to the accounts where it changes the outcome, which protects customer lifetime value and the bottom line.
The effect on net revenue retention can be large. In ZoomInfo's Customer Impact Report 2025, customer success teams reported net revenue retention rising from 60% before ZoomInfo to 81% after, and rated their accounts 54% healthier.
The Signals That Predict Churn
A churn prediction model is only as good as the signals it reads. The strongest models combine customer data from your own product and CRM with external data about what is happening inside the customer's company.
Signal type | Examples | What it tells you | Where it lives |
Behavioral | Feature usage, active seats, session recency | Whether the customer gets value | Product analytics |
Engagement | Meeting attendance, email replies, QBR participation | Whether the relationship is active | CRM and email |
Support and sentiment | Support tickets, escalations, Net Promoter Score, Customer Effort Score, call tone | Whether frustration is building | Help desk, surveys, call recordings |
Transactional | Billing events, monthly recurring revenue changes, downgrades, tenure | How exposed the renewal is | Billing and CRM |
People | Champion departure, new executives, buying group changes | Whether the people who bought you are still there | Mostly outside your systems |
Market | Competitor research, layoffs, mergers, funding | Whether the account's priorities are shifting | Third-party data |
The first four live inside your own systems, and that is where most health scores stop. Even these behavioral, engagement, and transactional signals reward a little extra analysis. Anomaly detection on usage behavior catches a sudden drop that a monthly average hides. Web analytics can show a customer reading your cancellation or data export pages. Text analysis and natural language processing on support tickets and call recordings pick up frustration long before a Net Promoter Score survey does.
The last two often move first. A champion who leaves takes the reason the account bought you with them, and their replacement may already have a preferred vendor. Henry Schuck, CEO and founder of ZoomInfo, says:
"Most renewal risk doesn't show up in your CRM. The real signal is when someone from the original buying group leaves, and no one notices."
ZoomInfo fills that gap with real-time data from outside your systems. Job change alerts flag when a champion or buyer leaves a customer account, org charts show who replaced them, and intent data shows when a customer starts researching your competitors. Scoops add company news such as layoffs, reorganizations, and acquisitions that can reset a customer's priorities overnight.
A churn model that reads people signals catches risk a usage dashboard misses. Here is how SpringDB put that to work.

"You'll get 10x the value if you think of ZoomInfo as a full platform and not just a tool for one team."
How to Build a Customer Churn Prediction Model
A customer churn prediction model does not need a data science team to start. The six steps below work for a rules-based health score and scale up to machine learning as your renewal history grows.
1. Define Churn and the Prediction Window
Start by agreeing what counts as a churn event. Decide whether a downgrade counts as partial churn, how paused accounts are treated, and whether you are predicting logo churn, revenue churn, or both. Sales, customer success, and finance should use the same definition, or the model will learn from inconsistent outcomes.
Decide the level you predict at, too. Most B2B teams score at the customer level. Multi-product companies often add a score at the product level, since a customer can keep one product and cancel another.
Then set the prediction window, meaning how far ahead of the renewal you score each account. The window has to leave time to act. ZoomInfo starts renewal conversations 90 days before the renewal date, and enterprise agreements often warrant 90 to 120 days.
2. Build a Training Dataset From Past Renewals
Pull every renewal from the last two to three years and label each one with its churn status, whether renewed, contracted, or churned. For each renewal, capture the signals as they looked at the start of your prediction window, before the outcome was known. Add the customer profile too, such as industry, company size, and contract value, since churn patterns often differ by segment.
Two problems trip up many first models. The first is leakage. Signals recorded after the customer gave notice, such as a cancelled QBR, make the model look accurate in testing and fail in practice. The second is class imbalance. If 90% of your renewals succeed, a model can score 90% accuracy by predicting that everyone renews. Weight the churned accounts more heavily, or resample the data, so the model learns what churn looks like.
Clean, deduplicated records matter as much as the method, since poor data quality in the CRM becomes poor predictions in the model.
3. Choose a Modeling Approach
The right model depends on how much data you have and how much you need to explain its output. Most teams start simple and move up as their renewal history grows.
Approach | How it works | Best for | Watch for |
Rules-based health score | Weighted points for usage, support, and engagement | Teams starting out with little history | Weights are guesses until you test them |
Logistic regression | Estimates churn probability from a set of inputs | An explainable baseline model | Misses complex interactions between signals |
Decision trees and ensembles | Random forests and gradient boosted trees combine many decision trees | Larger datasets with mixed signal types | Harder to explain to account teams |
Survival analysis | Models the time until an account churns | Predicting when risk peaks, as well as whether | More setup and statistical expertise |
Neural networks | Learn complex patterns across many inputs | Very large datasets, such as consumer subscriptions | Rarely worth it at B2B data volumes |
Data science teams usually build these predictive models with standard Python libraries such as scikit-learn and XGBoost. Newer artificial intelligence techniques do not change the basics. A random forest classifier trained on clean, well-labeled renewals usually beats a more complex model trained on messy data.
ZoomInfo's own model combines two parts. A usage score flags customers using fewer licenses than expected over a trailing 30 days, and a separate machine learning model grades every customer from A to F on likelihood to churn, based on the products used, firmographics, spend, and tenure. Account managers hold firm on pricing with A-rated customers and focus on upsell, while F-rated customers trigger a save plan, according to the Data-Driven Account Manager report.
You can build and run scoring models like this in GTM Studio, or push ZoomInfo data into the warehouse where your data team already works through data as a service.
4. Test Model Performance Before You Trust It
Before the model goes live, run a performance evaluation on renewals it has never seen, ideally your most recent quarter or two. A confusion matrix shows where the model is right and wrong, and four measures tell you whether it is ready:
Precision. Of the accounts flagged as high risk, how many actually churned? Low precision wastes customer success time on healthy accounts.
Recall. Of the accounts that churned, how many did the model flag in time? Low recall means surprise losses.
Lift and ROC curve. How much more churn is concentrated in the top-scored accounts than the average? The ROC curve shows how well the model separates churners from renewals across every risk threshold.
Calibration. When the model says 30% risk, do about 30% of those accounts churn? Calibration is what makes the scores usable in a forecast.
Retest every quarter. Customer behavior, pricing, and the product all change, and a model trained on last year's renewals loses predictive performance over time.
5. Turn Scores Into a Renewal Forecast
A calibrated churn score converts straight into a revenue forecast. Multiply each renewal's annual value by its chance of renewing, then add them up. The example below shows four accounts renewing next quarter.
Account | Annual value | Churn probability | Expected renewal | Revenue at risk |
Account A | $120K | 10% | $108K | $12K |
Account B | $80K | 45% | $44K | $36K |
Account C | $60K | 70% | $18K | $42K |
Account D | $40K | 5% | $38K | $2K |
Total | $300K |
| $208K | $92K |
A forecast that assumes every renewal closes would show $300K. The probability-weighted forecast shows $208K, which is the number to plan around.
The revenue at risk column shows where to spend save effort. Account C carries the largest potential revenue loss, but at 70% risk it may already be gone. Account B carries almost as much at 45% risk, which usually makes it the better save target. Weighing revenue at risk against how saveable an account still is turns the forecast into a prioritized list of accounts for the quarter.
6. Act on the Scores and Retrain
A score only reduces churn when it reaches the person who owns the account, inside the tools they already use. Route high-risk scores to account managers as alerts rather than leaving them in interactive dashboards no one checks. Track which accounts received a save play, A/B test plays where volume allows, and feed the outcomes back into the training data each quarter. Every renewal cycle you record sharpens the model's predictive insights.
Predictive Churn Analysis: Turn Risk Scores Into Saves
Predictive churn analysis is only valuable if it changes what your team does next. The best retention strategies match the response to the level of risk, the size of the account, and the reason the model flagged it.
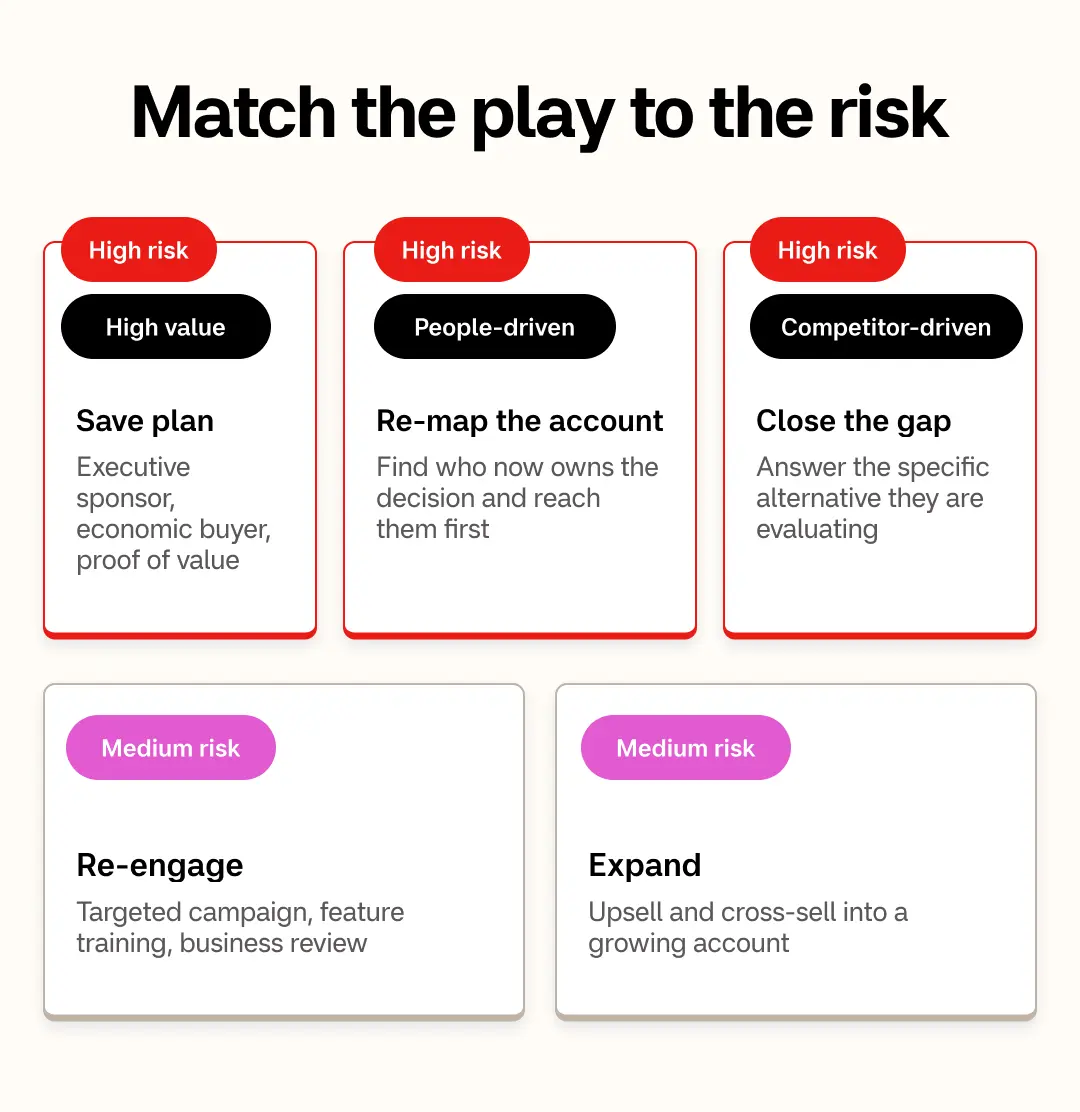
High risk, high value. Build a save plan with an executive sponsor. Reach the economic buyer directly, rebuild the case for value with results the customer has achieved, and address the specific driver the model surfaced.
High risk, people-driven. When the champion has left, re-map the account right away. Stakeholder mapping shows who now owns the decision, and direct dials get you to them before a competitor does.
High risk, competitor-driven. When intent shows the customer researching alternatives, use competitive intelligence to run a competitor analysis and answer the specific gap they are evaluating.
Medium risk. Run a targeted re-engagement campaign, offer training on the features the customer underuses, and book a business review before customer engagement drops further.
Low risk with growth signals. Treat these as expansion opportunities. Rising headcount and full license usage point to upsell and cross-selling opportunities.
Proactive saves also build customer loyalty. When an account team fixes a problem before the customer raises it, customer experience and satisfaction both improve.
Churn risk "rarely announces itself in one specific system," as Florin Tatulea, GTM Engineer in Residence at ZoomInfo, puts it on the Revenue Architects podcast. In the episode, he and host John Lloyd build a churn prevention play in a few prompts. Pull the accounts inside their renewal window, add pain points from call recordings, layer in competitive intent, score the risk, and draft outreach for the critical ones.
Teams can run that play in Claude or ChatGPT through the ZoomInfo MCP, drawing on the GTM Context Graph, which processes more than 1.5 billion data points a day across CRM activity, conversation intelligence, intent, and people data. In GTM Workspace, account managers can run the same analysis across their whole book of business and get a ranked list of at-risk accounts with next steps. Here's a short video on how it works:
Common Churn Prediction Mistakes
A few habits quietly undo even well-built models. Watch for these:
Scoring too close to the renewal. A risk flag 30 days out leaves little room for a save. Score early enough to run a full play.
Judging the model on accuracy alone. With class imbalance, accuracy hides a model that never flags anyone. Check precision, recall, and calibration.
Watching only product usage. Usage can hold steady right up until a new executive cancels the contract. Add people and market buying signals to catch that.
Building on stale contact data. B2B data decays as people change roles, so a health score built on an outdated CRM record can show a champion who left months ago. Regular CRM hygiene and continuous data enrichment keep the inputs honest.
Treating the score as the outcome. A prediction prevents nothing on its own. Track which flagged accounts got a play and what happened next.
Forecast Renewals You Can Plan Around
You can start with the renewals already on your books. Agree on what counts as churn, train on past renewals, test against recent ones, and convert the scores into a probability-weighted forecast. Then route the risk to the people who can act on it.
If you are comparing platforms to run this on, our roundup of churn prediction software covers the main options. For the renewal motion that follows, see our guide to contract renewal management, and for a broader customer retention strategy, our playbook on improving customer retention.
See renewal risk before it becomes churn. Book a ZoomInfo demo to catch champion departures, competitor research, and buying group changes across your customer base. ZoomInfo is free to start with consumption credits based on usage.
Frequently Asked Questions
These are the questions customer success, account management, and RevOps teams ask most often about churn prediction.
What is churn prediction?
Churn prediction is the use of customer data and machine learning to estimate which customers are likely to cancel or not renew within a set period. Each account receives a risk score, so teams can act on at-risk renewals before the customer decides to leave.
How do you build a customer churn prediction model?
Define what counts as churn and how far ahead you will predict it. Build a dataset of past renewals with the signals captured before each outcome was known, correct for class imbalance, choose a modeling approach, test it on recent renewals, and route the scores to the account teams who can act on them. Retrain the model every quarter.
What is predictive churn analysis?
Predictive churn analysis uses historical churn patterns to score current customers by their likelihood of leaving. Standard churn analysis explains why past customers left. Predictive analysis looks forward, so teams can intervene before the renewal.
Which machine learning model is best for predicting customer churn?
There is no single best model. Among predictive churn models, logistic regression gives an explainable baseline, tree-based models such as random forests and gradient boosted trees often score more accurately on larger datasets, and survival analysis predicts when an account is likely to churn. The quality of the input data usually matters more than the choice of algorithm.
How far in advance can you predict churn?
Most B2B teams score accounts 90 to 120 days before renewal, which leaves time to run a save plan. Some signals, such as a champion leaving or a sustained drop in usage, can flag risk six months or more ahead.
What signals predict customer churn?
The most common are falling feature usage, declining engagement, rising support tickets, and negative sentiment. People signals, such as a champion leaving or a new executive arriving, and market signals, such as research into competitors, often appear before any change in usage.
