
Churn feels like a surprise when nobody is watching the right signals. A customer health score pulls those signals into one number your customer success team checks every week, so a slipping account gets attention while it can still be saved.
This guide covers the metrics that belong in a health score, a six-step process to build one, a ready-to-use template with a worked example, and what to do at each score level. It also shows where most health scores have a blind spot, and how to close it.
What Is a Customer Health Score?
A customer health score is a single number, usually on a 0 to 100 scale, that shows how likely a customer is to renew, expand, or churn. It combines customer metrics such as product usage, support interactions, customer feedback, and the strength of the customer relationship into a weighted average that customer success managers and account managers can track over time.
A good score does two jobs. It flags churn risk early, and it surfaces expansion potential in accounts that are growing. Customer success teams use it to decide where to spend the week, and revenue teams use it to forecast renewals. The score is descriptive analytics, showing what is happening in an account. The play tied to each score band makes it prescriptive.
ZoomInfo's leadership watches health scores too, as one test of whether a new product is landing with customers. James Roth, Chief Revenue Officer at ZoomInfo, said on The GTMnow Podcast:
"It's one thing to release a new product. It's another thing to see significant upticks in the net retention or the utilization or the health score of that product."
A health score is different from a churn prediction model. The score uses rules your team can explain, so a customer success manager can see why an account dropped and what to do about it. A churn model is the statistical version, built with machine learning on years of renewal history. Most health scoring models start rule-based, and teams add predictive analytics once the data supports it.
Customer Health Score Metrics
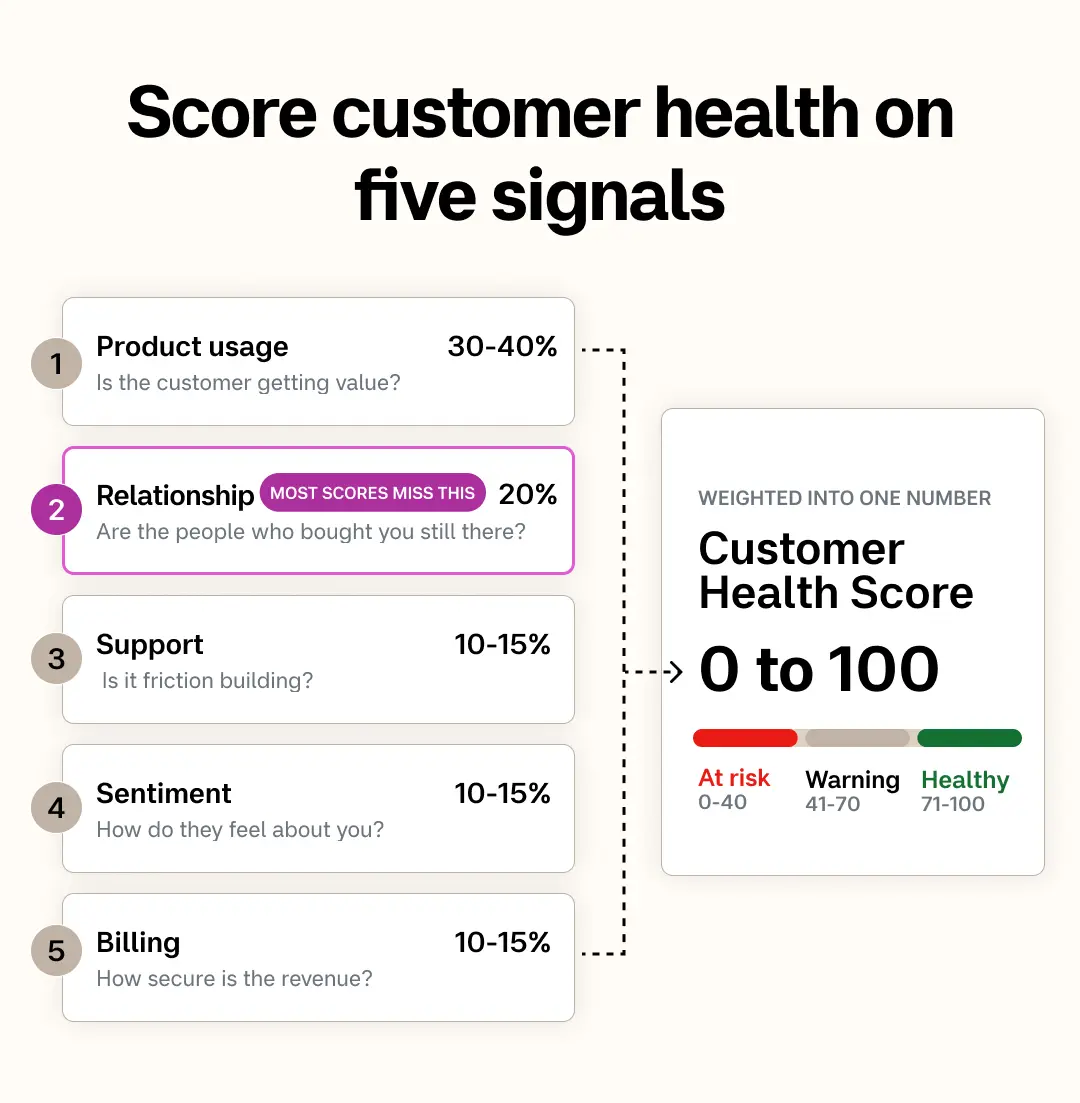
The strongest health scores pull from five categories of signal. Each one catches a different kind of risk, so a score built on one category alone will miss the others.
Category | Metrics to track | What it tells you | Starting weight |
Product usage | Usage frequency, active users per licensed seat, feature usage, product adoption | Whether the customer gets value | 30% to 40% |
Support | Support ticket volume and severity, live chat and escalations, support trends over 90 days | Whether friction is building | 10% to 15% |
Sentiment | Net Promoter Score, customer satisfaction survey results, in-app surveys, CSM sentiment | How the customer feels about you | 10% to 15% |
Relationship | Champion engaged, executive sponsor active, number of stakeholders, people changes | Whether the people who bought you are still there | 20% |
Billing and commercial | Billing behavior, payment timeliness, downgrade requests, license growth | How secure the revenue is | 10% to 15% |
A few rules make each category more accurate:
Product usage. Measure the product usage rate against licensed seats, so large and small accounts score on the same scale. Usage decline is usually the first of the behavioral metrics to move.
Support. Weight severity and support trends over raw volume. A customer filing how-to tickets is engaged, while a run of high-severity customer support tickets is a warning. Natural language processing on ticket text, and conversation intelligence on calls, pick up frustration before a survey does.
Sentiment. Keep the weight modest, since B2B survey response rates are often low. Combine Net Promoter Score and customer surveys with CSM sentiment, which captures what the account team has noticed. Log those notes in your CRM rather than a private doc, so the context survives when an account changes hands.
Relationship. This is the blind spot in most scores. Product data cannot see that the customer champion left last month, and that gap is behind a lot of surprise churn. Job change alerts flag when a champion or executive sponsor leaves, and org charts show who now holds the decision.
Billing. Late payments, downgrade requests, and license reductions are strong predictive factors. License growth points the other way, toward expansion.
External market signals add context the score cannot generate on its own. Intent data shows when a customer starts researching your competitors, and Scoops flag layoffs, reorganizations, and acquisitions that can reset a customer's priorities.
Levanta's team leans on exactly these signals to keep relationships current. Here is how they use ZoomInfo.

“We use it to find mobile numbers, direct emails, job change signals, anything that helps us break through the noise.”
How to Build a Customer Health Score in 6 Steps
You can launch a health score program in a few weeks with data you already have. The six steps below take you from a definition to a live score you have checked against real outcomes.
1. Define What Healthy Means for Your Business
Start with the outcome the score predicts. For most B2B teams that is renewal, plus expansion for the accounts most likely to grow. Write the definition down so customer success, sales, and finance score against the same goal.
Then decide whether one score fits your whole base. A self-serve cohort and an enterprise segment behave differently, so many teams run separate scores, or at least separate weights, for each customer segment.
2. Pick Metrics That Separate Renewals From Churn
Compare your last two years of renewed and churned accounts, using your customer churn data, and list the metrics that looked different before the outcome. Those are your predictive factors. Keep the first version to five to eight metrics across the five categories above. More than that makes the score hard to explain and slow to act on.
3. Set Scoring Thresholds for Each Metric
Convert each metric to a 0 to 100 scale with clear thresholds. For example, weekly active users at 70% or more of licensed seats might score 100, 40% to 69% might score 50, and anything lower scores 0.
ZoomInfo's own health model works this way. Its core measure is license compliance, the share of purchased licenses a customer actually uses over a trailing 30 days. SMB customers below 50% are flagged out of compliance, with higher thresholds for mid-market and enterprise accounts, according to ZoomInfo's Data-Driven Account Manager report.
4. Weight the Metrics and Calculate the Score
Multiply each metric's score by its weight and add them up. The result is a weighted average on the same 0 to 100 scale. Start with the weights in the metrics table, then adjust them as you see which signals move before churn.
Rule-based models are the right place to start because everyone can see why an account scored the way it did. AI scoring and machine learning can sharpen the weights later, but only once the process around the score already works.
5. Set Tiers and Score Triggers
Group scores into tiers and attach an automated action to each one. A common starting point is 71 to 100 for healthy, 41 to 70 for warning, and 0 to 40 for at risk. Score triggers then fire the retention workflow, such as a Slack notification to the account owner when a score drops below a threshold, or a task in the CRM when it falls a full tier.
At ZoomInfo, when a customer falls out of compliance, the system alerts the customer success manager automatically and prescribes a set of touchpoints to understand why. Part of each CSM's monthly compensation is tied to how many customers they bring back into compliance, which keeps the score at the center of the job. ZoomInfo's go-to-market agents run off the same kind of triggers, such as an account reaching 90 days from renewal.
6. Validate the Score and Recalibrate
Check the score against what actually happened, and against your churn rate. Each quarter, look at the accounts that churned and ask whether the score flagged them in time. Review trends over time as well as single readings, since a score falling from 85 to 65 in a month says more than a steady 65.
Every surprise churn is a clue. If a churned account still showed as healthy, find the signal the score missed and add it.
Customer Health Score Template
The template below shows how the six steps come together, with a worked example for one account. Use it as a starting customer health scorecard and adjust the metrics, thresholds, and weights to your own data.
Metric | Weight | Scores 100 | Scores 50 | Scores 0 | Example account |
Usage frequency (weekly active users per licensed seat) | 25% | 70% or more | 40% to 69% | Under 40% | 50 |
Feature adoption (core features used, out of 5) | 15% | 4 to 5 | 2 to 3 | 0 to 1 | 100 |
Support trends (high-severity tickets, last 90 days) | 15% | None | 1 to 2 | 3 or more | 50 |
Net Promoter Score (latest response) | 10% | 9 to 10 | 7 to 8 | 0 to 6 | 100 |
Relationship (champion and executive sponsor) | 20% | Both engaged | One engaged | Champion left | 0 |
Billing behavior | 10% | Paid on time | One late payment | Overdue or downgrade requested | 100 |
CSM sentiment | 5% | Positive | Neutral | Negative | 50 |
The example account scores 57.5, which puts it in the warning tier. The calculation is (50 × 0.25) + (100 × 0.15) + (50 × 0.15) + (100 × 0.10) + (0 × 0.20) + (100 × 0.10) + (50 × 0.05).
Without the relationship row, the same account would score about 72 and show as healthy. Usage is middling, the NPS is strong, and the bills are paid. The only thing that moves it into the warning tier is the champion leaving, which is exactly the kind of change that never shows up in product data.
What to Do at Each Health Score Level
A health score only reduces churn when each tier triggers a clear play. The response should match the score, the size of the account, and the reason the score moved.
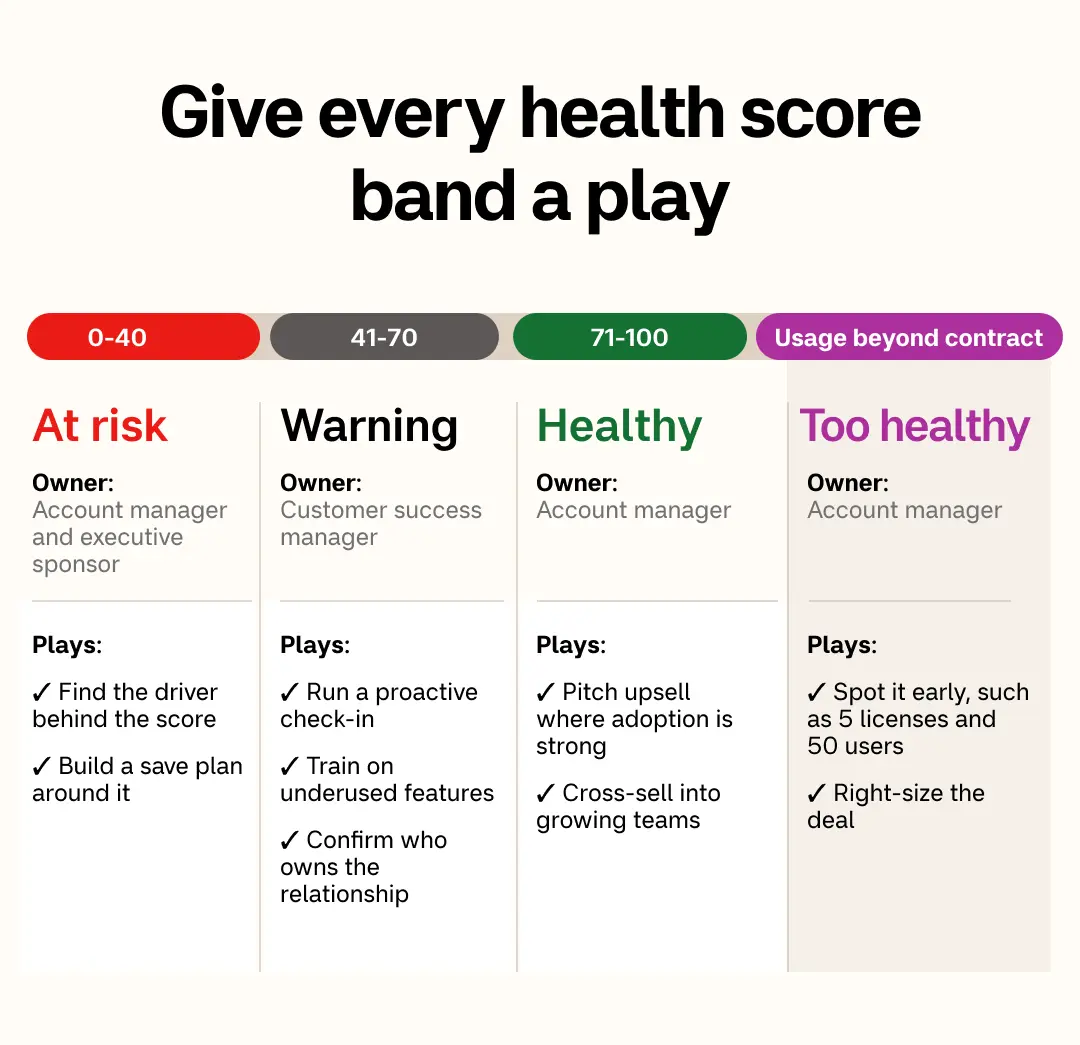
At risk (0 to 40). Escalate to the account manager and an executive sponsor. Find the driver behind the score, whether that is usage decline, a support issue, or a departed champion, and build a save plan around it.
Warning (41 to 70). Run a proactive check-in or a targeted nurture campaign, offer training on underused features, and confirm who owns the relationship. If the champion has changed, use stakeholder mapping to reach the new decision-maker early.
Healthy (71 to 100). Look for expansion. Strong product adoption, steady customer engagement, and rising headcount point to upsell and cross-selling opportunities.
Too healthy. Usage beyond the contract is an expansion signal too. ZoomInfo has found customers with five purchased licenses and 50 IP addresses accessing them, which gives the account manager a clear reason to right-size the deal.
The same score can call for opposite plays, depending on which way usage is moving. Brendan Powers, Principal Go-to-Market Operations and Engineering Manager at ZoomInfo, said on ZoomInfo's Revenue Architects podcast:
"We're probably going to have a very different play for a customer that is hardly logging into the platform versus a customer that is... almost exceeding their license volume or credit volume."
Where the account sits in the customer lifecycle changes how you read the score. Early scores show whether onboarding landed and the customer experience matches what was sold. Mid-term scores guide your customer expansion strategy, and scores in the months before renewal shape the contract renewal conversation.
Where ZoomInfo Fits in Your Health Scoring
Health scores usually run inside customer success software and CRM systems, which see what happens inside your product and your support queue. ZoomInfo adds what happens inside the customer's company, so the score reflects risks and opportunities your own systems cannot see.
GTM Workspace. GTM Workspace gives account managers a live view of retention signals, including engagement drops, org changes, and stakeholder turnover, alongside verified contacts to act on them.
GTM Studio. GTM Studio lets RevOps teams build scoring models and retention workflows on ZoomInfo data.
MCP. Teams that score accounts in their own warehouse or AI tools can pull the same data through the ZoomInfo MCP in assistants such as Claude and ChatGPT.
Data enrichment. Continuous data enrichment keeps the contact records behind the relationship score current, since B2B data decays as people change roles.
All of it draws on the GTM Context Graph, which processes more than 1.5 billion data points a day across CRM activity, conversation intelligence, intent, and people data, so the signals reach your score in real time.
Common Customer Health Score Mistakes
A few habits quietly undo a customer health scoring program. Watch for these:
Acting on the number alone. A score tells you where to look. Talk to the customer before you act on a number alone.
Tracking too many metrics. Twenty inputs make the score impossible to explain. Five to eight is enough to start.
Treating the score as a report. A score that nobody acts on prevents nothing, and the churn shows up later as revenue leakage. Every tier needs an owner and a play.
Setting weights once. Customer behavior and the product both change. Recheck the weights against churn outcomes every quarter.
Building on stale CRM data. A relationship score that still shows a departed champion is worse than no score at all. Regular CRM hygiene keeps the inputs honest.
Turn Your Health Score Into a Retention Workflow
A customer health score is only as useful as the actions it triggers. Pick five to eight metrics that separated past renewals from churn, weight them into one score, and tie each tier to a play your team runs every week. Then check the score against real outcomes each quarter and fix what it missed.
To turn scores into a renewal forecast, see our guide to forecast accuracy. For the wider retention motion, see our playbook on improving customer retention and our guide to customer lifetime value.
See the account changes your health score is missing. Book a ZoomInfo demo to add champion departures, competitor research, and org changes to your customer health scoring. ZoomInfo is free to start with consumption credits based on usage.
Frequently Asked Questions
These are the questions customer success professionals and account managers ask most often about customer health scores.
What is a customer health score?
A customer health score is a single number, usually from 0 to 100, that shows how likely a customer is to renew, expand, or churn. It combines signals such as product usage, support interactions, customer sentiment, relationship strength, and billing behavior into a weighted average.
How do you calculate a customer health score?
Choose five to eight metrics, convert each to a 0 to 100 scale with clear thresholds, and give each a weight. Multiply each metric's score by its weight and add the results. The total is the account's health score.
What metrics should a customer health score include?
Most scores include product usage frequency and feature adoption, support ticket trends, Net Promoter Score or other customer feedback, relationship signals such as champion and executive sponsor engagement, and billing behavior. B2B teams should also track people changes, since a departed champion is a strong churn signal.
What is a good customer health score?
A common starting point treats 71 to 100 as healthy, 41 to 70 as warning, and 0 to 40 as at risk. The right bands depend on your own churn history, so check which scores your churned accounts had before they left and adjust from there.
What is the difference between a customer health score and NPS?
Net Promoter Score measures how likely a customer is to recommend you, based on a single survey question. A customer health score combines NPS with usage, support, relationship, and billing signals, so it reflects what customers do as well as what they say.
How often should you update customer health scores?
Update usage and support inputs daily or weekly, and review the overall score at least weekly. Revisit the metrics and weights every quarter against actual churn and renewal outcomes.
